Notice
Due to a lapse in appropriations, this website is not being updated.
Bureau of Economic Analysis
U.S. International Investment Position, 2nd Quarter 2025
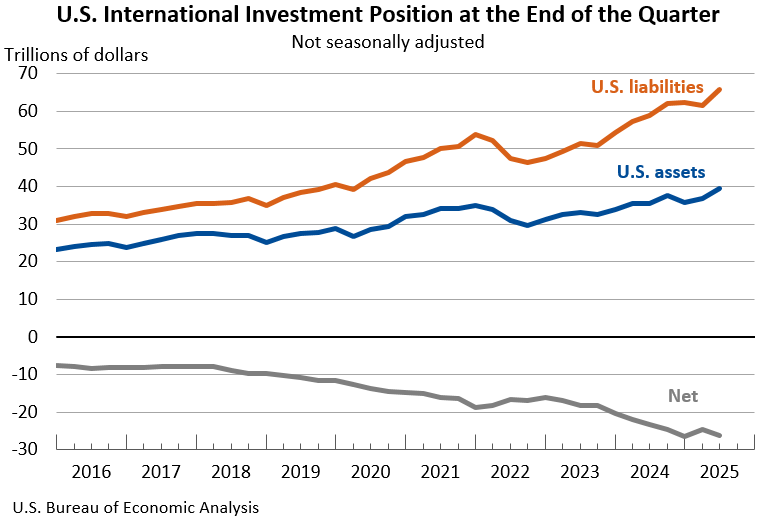
The U.S. net international investment position, the difference between U.S. residents’ foreign financial assets and liabilities, was -$26.14 trillion at the end of the second quarter of 2025, according to statistics released today by the U.S. Bureau of Economic Analysis. Assets totaled $39.56 trillion, and liabilities were $65.71 trillion. At the end of the first quarter, the net investment position was -$24.65 trillion (revised).
Principal Federal Economic Indicators
Noteworthy
The Latest
Outdoor Recreation Satellite Account: Updated Statistics for 2012-2016
Updated statistics from the Outdoor Recreation Satellite Account (ORSA) released today by the U.S. Department of Commerce’s Bureau of Economic Analysis (BEA) show that the outdoor recreation economy accounted for 2.2 percent ($412 billion) of current-dollar GDP in 2016. In data produced for the first time, using inflation-adjusted (real) GDP, the outdoor recreation economy grew 1.7 percent in 2016, faster than the 1.6 percent growth for the…
U.S. Current-Account Deficit Decreases in Second Quarter 2018
The U.S. current-account deficit decreased to $101.5 billion (preliminary) in the second quarter of 2018 from $121.7 billion (revised) in the first quarter of 2018. As a percentage of U.S. GDP, the deficit decreased to 2.0 percent from 2.4 percent. The previously published current-account deficit for the first quarter was $124.1 billion.
U.S. International Transactions: Second Quarter 2018
The U.S. current-account deficit decreased $20.2 billion to $101.5 billion (preliminary) in the second quarter of 2018.
Gross Domestic Product by Metropolitan Area, 2017
Real gross domestic product (GDP) increased in 312 out of 383 metropolitan areas in 2017. The percent change in real GDP by metropolitan area ranged from 12.1 percent in Odessa, TX to -7.8 percent in Enid, OK.
Coming Soon: An Enhanced Set of Outdoor Recreation Statistics
BEA’s first-ever measurement of the economic power of outdoor recreation, released in February, found that the industry’s contribution to the U.S. economy in 2016 was bigger than other industries like legal services or publishing. Soon people will learn even more about the economic value of outdoor pursuits like canoeing, hunting, RVing, and snowboarding.
July 2018 Trade Gap is $50.1 Billion
The U.S. monthly international trade deficit increased in July 2018 according to the U.S. Bureau of Economic Analysis and the U.S. Census Bureau. The deficit increased from $45.7 billion in June (revised) to $50.1 billion in July, as exports decreased and imports increased. The previously published June deficit was $46.3 billion. The goods deficit increased $4.2 billion in July to $73.1 billion. The services surplus decreased $0.1 billion in…
U.S. International Trade in Goods and Services, July 2018
The U.S. monthly international trade deficit increased in July 2018 according to the U.S. Bureau of Economic Analysis and the U.S. Census Bureau. The deficit increased from $45.7 billion in June (revised) to $50.1 billion in July, as exports decreased and imports increased. The previously published June deficit was $46.3 billion. The goods deficit increased $4.2 billion in July to $73.1 billion. The services surplus decreased $0.1 billion in…
Personal Income Rises in July
Personal income increased 0.3 percent in July after increasing 0.4 percent in June. Wages and salaries, the largest component of personal income,increased 0.4 percent in July, the same increase as in June.
Personal Income and Outlays, July 2018
Personal income increased 0.3 percent in July after increasing 0.4 percent in June. Wages and salaries, the largest component of personal income, increased 0.4 percent in July, the same increase as in June.


