Bureau of Economic Analysis
Direct Investment by Country and Industry, 2024
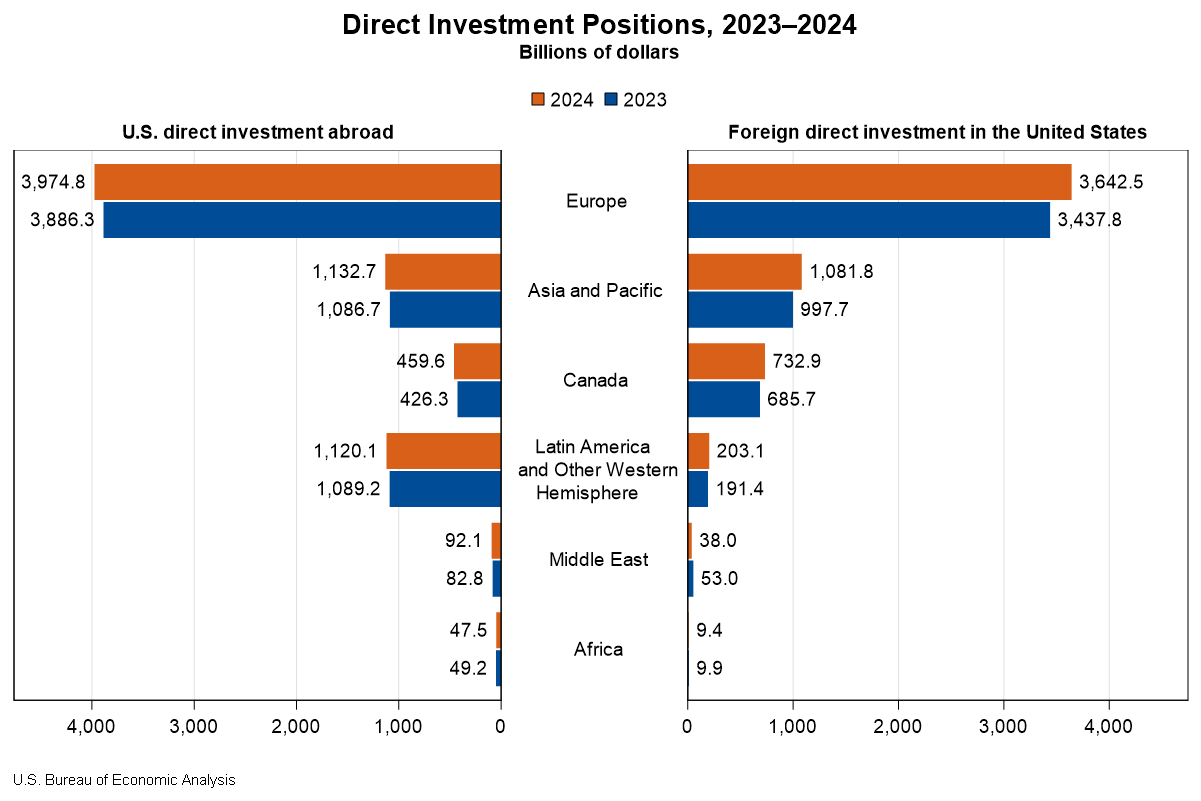
The U.S. direct investment abroad position, or cumulative level of investment, increased $206.3 billion to $6.83 trillion at the end of 2024, according to statistics released today by the U.S. Bureau of Economic Analysis. The increase was led by an $88.4 billion increase in the position in Europe, primarily in Luxembourg and Germany. By industry, manufacturing affiliates had the largest increase, led by manufacturing of computers and electronic products.
The foreign direct investment in the United States position increased $332.1 billion to $5.71 trillion at the end of 2024. The increase was led by a $204.7 billion increase in the position from Europe, which reflected a $52.9 billion increase from the United Kingdom and a $39.7 billion increase from Germany. By industry, affiliates in manufacturing increased the most.
Principal Federal Economic Indicators
Noteworthy
- 2025 News Release Schedule
- Innovation at BEA
- 2025 Annual Updates
- New! Services Trade Data for More Countries
- Data Tool: Trade in Value Added
- Distribution of State Personal Income
- Updated: RIMS II Regional Multipliers
- Arts and Culture
- Space Economy
- FDI Now in State BEARFACTS
- Quick Guide: Price Indexes
The Latest
Broad Growth Across States in 2014
Real GDP increased in 48 states and the District of Columbia in 2014. Leading industry contributors were professional, scientific, and technical services; nondurable goods manufacturing; and real estate and rental and leasing. Professional, scientific, and technical services was the largest contributor to U.S. real GDP by state growth in 2014. This industry contributed to real GDP growth in 46 states and the District of Columbia.
A Snapshot of the Seasonal Adjustment Process for GDP
A lot of work goes into measuring a $17 trillion economy. And, at the Bureau of Economic Analysis it’s a process that never really stops.
In addition to calculating Gross Domestic Product, a key economic indicator of how the U.S. economy is faring, BEA also produces thousands of related data points each month that flow from our GDP reports and give us rich detail about consumer spending, business investment and government activity.…
Gross Domestic Product by State, Advance 2014 and Revised 1997-2013
Real gross domestic product (GDP) increased in 48 states and the District of Columbia in 2014, according to new statistics released today by the Bureau of Economic Analysis (BEA). Professional, scientific, and technical services; nondurable goods manufacturing; and real estate and rental and leasing were the leading contributors to real U.S. economic growth. U.S. real GDP grew 2.2 percent in 2014 after increasing 1.9 percent in 2013.
2014 GDP by State Statistics to be Released June 10
Statistics on the 2014 economic performance of all 50 states and the District of Columbia, will be released Wednesday, June 10 at 8:30 a.m. EDT by the U.S. Bureau of Economic Analysis.
April 2015 Trade Gap is $40.9 Billion
The U.S monthly international trade deficit decreased in April 2015 according to the U.S. Bureau of Economic Analysis and the U.S. Census Bureau. The deficit decreased from $50.6 billion in March (revised) to $40.9 billion in April, as exports increased and imports decreased. The previously published March deficit was $51.4 billion. The goods deficit decreased $9.3 billion from March to $60.7 billion in April. The services surplus increased $…
U.S. International Trade in Goods and Services, April 2015
U.S. Census Bureau U.S. Bureau of Economic Analysis NEWS U.S. Department of Commerce * Washington, DC 20230 U.S. INTERNATIONAL TRADE IN GOODS AND SERVICES April 2015 The U.S. Census Bureau and the U.S.
U.S. International Trade in Goods and Services, 2015 Annual Revision
U.S. Census Bureau U.S. Bureau of Economic Analysis NEWS U.S. Department of Commerce * Washington, D.C. 20230
U.S. International Trade in Goods and Services
Annual Revision for 2014
Disposable Income Rises in April
Personal income increased 0.4 percent in April after increasing less than 0.1 percent in March. Wages and salaries, the largest component of personal income, rose 0.2 percent in April after rising 0.1 percent in March.
Current-dollar disposable personal income (DPI), after-tax income, increased 0.4 percent in April after rising less than 0.1 percent in March, reflecting increases in income receipts on assets and wages…
Personal Income and Outlays, April 2015
Personal income increased $59.4 billion, or 0.4 percent, and disposable personal income (DPI) increased $48.8 billion, or 0.4 percent, in April, according to the Bureau of Economic Analysis. Personal consumption expenditures (PCE) decreased $2.6 billion, or less than 0.1 percent.
First-Quarter GDP Revised Down: "Second" Estimate of GDP
Real gross domestic product (GDP) decreased 0.7 percent in the first quarter of 2015, according to the “second” estimate released by the Bureau of Economic Analysis. The growth rate was revised down 0.9 percentage point from the “advance” estimate released in April. In the fourth quarter of 2014, real GDP increased 2.2 percent.
GDP highlights The first-quarter decline in real GDP reflected declines in the following:


