Bureau of Economic Analysis
Direct Investment by Country and Industry, 2024
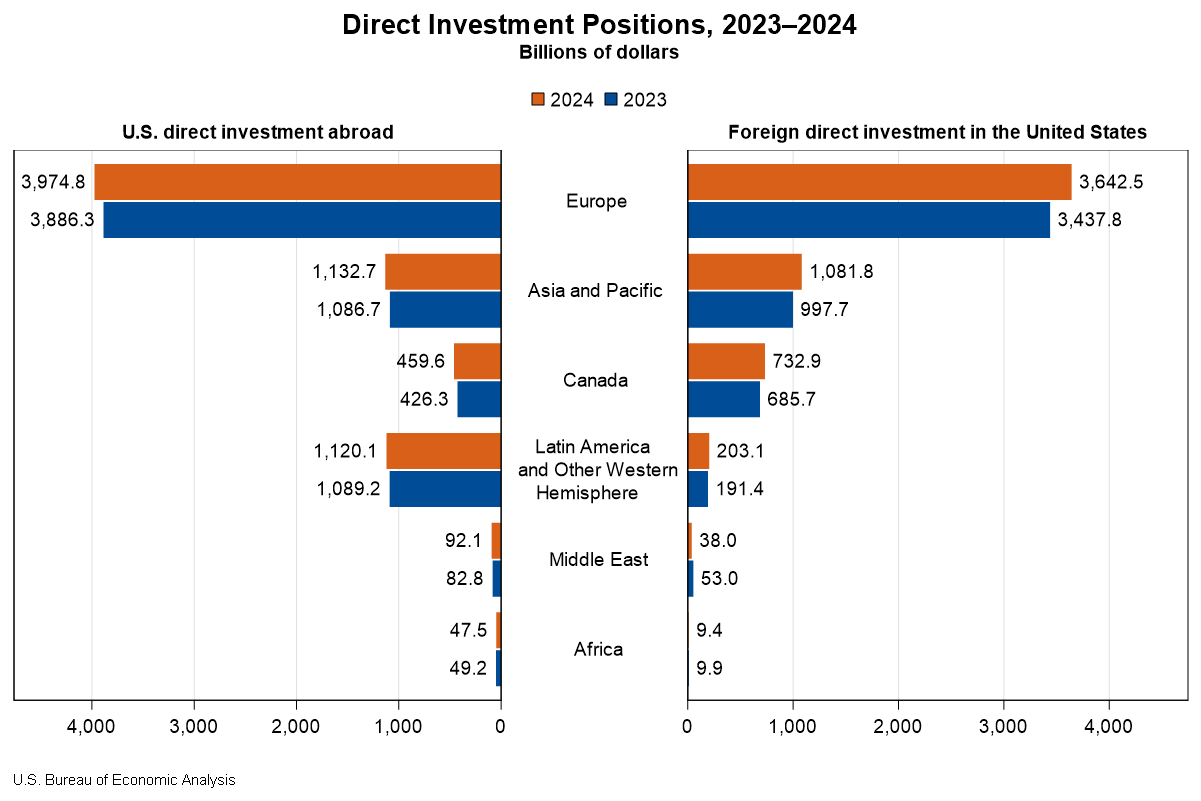
The U.S. direct investment abroad position, or cumulative level of investment, increased $206.3 billion to $6.83 trillion at the end of 2024, according to statistics released today by the U.S. Bureau of Economic Analysis. The increase was led by an $88.4 billion increase in the position in Europe, primarily in Luxembourg and Germany. By industry, manufacturing affiliates had the largest increase, led by manufacturing of computers and electronic products.
The foreign direct investment in the United States position increased $332.1 billion to $5.71 trillion at the end of 2024. The increase was led by a $204.7 billion increase in the position from Europe, which reflected a $52.9 billion increase from the United Kingdom and a $39.7 billion increase from Germany. By industry, affiliates in manufacturing increased the most.
Principal Federal Economic Indicators
Noteworthy
- 2025 News Release Schedule
- Innovation at BEA
- 2025 Annual Updates
- New! Services Trade Data for More Countries
- Data Tool: Trade in Value Added
- Distribution of State Personal Income
- Updated: RIMS II Regional Multipliers
- Arts and Culture
- Space Economy
- FDI Now in State BEARFACTS
- Quick Guide: Price Indexes
The Latest
State Personal Income 2013
Average state personal income growth slowed to 2.6 percent in 2013 from 4.2 percent in 2012. State personal income growth ranged from 1.5 percent in West Virginia to 7.6 percent in North Dakota, with every state growing more slowly in 2013 than in 2012. Inflation, as measured by the national price index for personal consumption expenditures, slowed to 1.1 percent in 2013 from 1.8 percent in 2012.
See the full report.
Restoration of Previously Eliminated Local Area Personal Income Statistics
The Bureau of Economic Analysis (BEA) will restore a portion of the statistical detail to its Local Area Personal Income (LAPI) program that had been eliminated due to sequestration and reduced funding levels in FY 2013.
In early May, BEA will release for 2001-2012 (1) local area employment statistics; (2) local area industry detail for compensation and earnings for 108 industries; (3) detail on farm income and expenses; (4) and…
State Quarterly Personal Income, 1st quarter 2013-4th quarter 2013; State Annual Personal Income, 2013 (preliminary estimates)
Average state personal income growth slowed to 2.6 percent in 2013 from 4.2 percent in 2012, according to estimates released today by the U.S. Bureau of Economic Analysis. State personal income growth ranged from 1.5 percent in West Virginia to 7.6 percent in North Dakota, with every state growing more slowly in 2013 than in 2012. Inflation, as measured by the national price index for personal consumption expenditures, slowed to 1.1 percent…
BEA Director Steve Landefeld to Retire
Steve Landefeld, Director of the U.S. Bureau of Economic Analysis, plans to retire in early May. Dr. Landefeld took the helm in May 1995 and in his 19 years as director was instrumental in implementing major changes aimed at better measuring the dynamic U.S. and world economies.
Under Dr. Landefeld’s leadership, the non-partisan BEA:
Travel and Tourism Spending Accelerated in the Fourth Quarter of 2013
Real spending on travel and tourism accelerated in the fourth quarter of 2013, increasing at an annual rate of 4.2 percent after increasing 3.1 percent (revised) in the third quarter of 2013.
Travel and Tourism Satellite Accounts, 4th quarter 2013
TRAVEL AND TOURISM SPENDING ACCELERATED IN THE FOURTH QUARTER OF 2013
U.S. Current-Account Deficit Decreases in Fourth Quarter 2013
The U.S. current-account deficit—the combined balances on trade in goods and services, income, and net unilateral current transfers—decreased to $81.1 billion (preliminary) in the fourth quarter of 2013 from $96.4 billion (revised) in the third quarter of 2013. As a percentage of U.S. GDP, the deficit decreased to 1.9 percent from 2.3 percent. The previously published current-account deficit for the third quarter was $94.8 billion.
Attention BEA Data Hounds: Our Interactive Tables Look a Little Different, But They Function the Same Way
Eagle-eyed folks using our interactive data tables have probably noticed they look a tad different.
Despite some differences in the way they look, BEA’s interactive data tables operate in the same way.
The changes are part of a BEA upgrade to the next generation of language used to create Web pages, called HTML5. This upgrade will make it easier for BEA to develop applications that are more robust and design Web…
New Statistics Will Provide More Timely Snapshot of How Industries are Performing
Want to know how much manufacturing contributed to U.S. economic growth in a given quarter? How about educational services?
For the first time, the Bureau of Economic Analysis (BEA) will soon start producing on a regular basis quarterly estimates of economic activity generated by 22 industries.


