Bureau of Economic Analysis
Direct Investment by Country and Industry, 2024
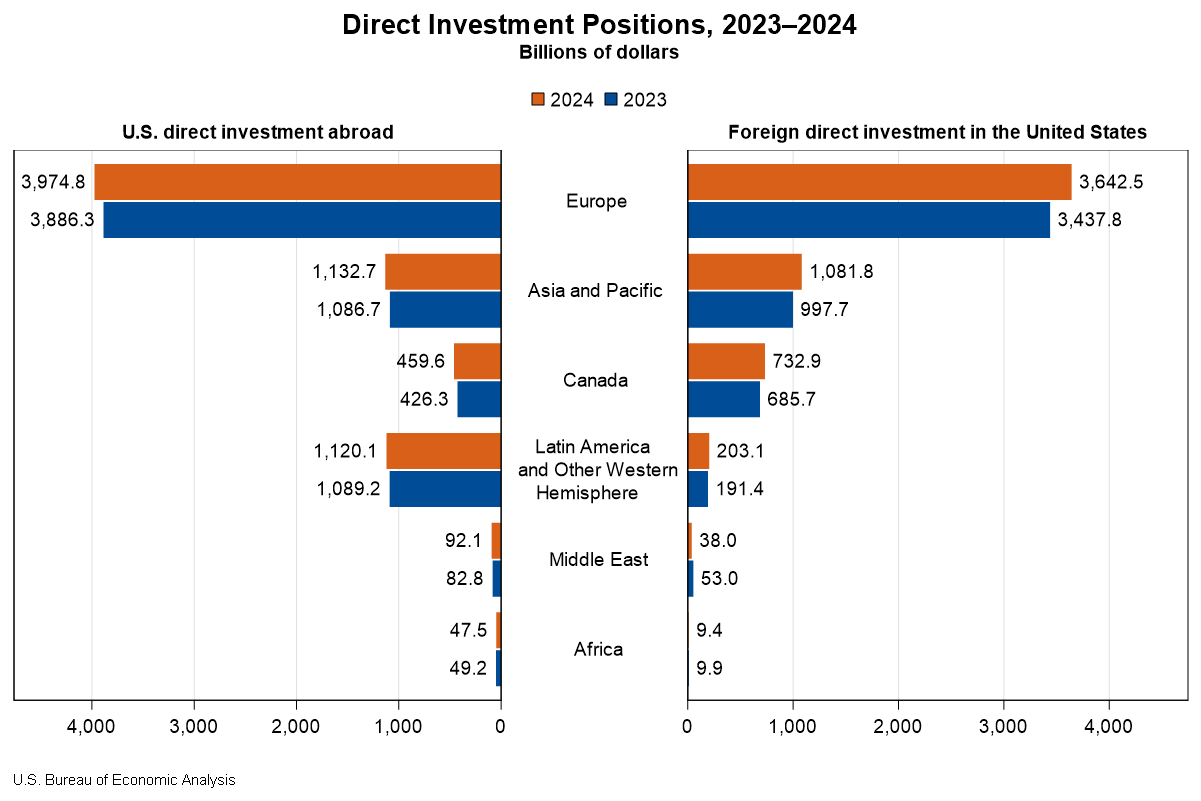
The U.S. direct investment abroad position, or cumulative level of investment, increased $206.3 billion to $6.83 trillion at the end of 2024, according to statistics released today by the U.S. Bureau of Economic Analysis. The increase was led by an $88.4 billion increase in the position in Europe, primarily in Luxembourg and Germany. By industry, manufacturing affiliates had the largest increase, led by manufacturing of computers and electronic products.
The foreign direct investment in the United States position increased $332.1 billion to $5.71 trillion at the end of 2024. The increase was led by a $204.7 billion increase in the position from Europe, which reflected a $52.9 billion increase from the United Kingdom and a $39.7 billion increase from Germany. By industry, affiliates in manufacturing increased the most.
Principal Federal Economic Indicators
Noteworthy
- 2025 News Release Schedule
- Innovation at BEA
- 2025 Annual Updates
- New! Services Trade Data for More Countries
- Data Tool: Trade in Value Added
- Distribution of State Personal Income
- Updated: RIMS II Regional Multipliers
- Arts and Culture
- Space Economy
- FDI Now in State BEARFACTS
- Quick Guide: Price Indexes
The Latest
Gross Domestic Product, 3rd quarter 2012 (advance estimate)
Real gross domestic product -- the output of goods and services produced by labor and property located in the United States -- increased at an annual rate of 2.0 percent in the third quarter of 2012 (that is, from the second quarter to the third quarter), according to the "advance" estimate released by the Bureau of Economic Analysis.
What is the U.S. Financial Account?
The U.S. financial account is a key component of the Bureau of Economic Analysis’ international transactions accounts (ITAs). The financial account presents the cross-border flows of funds generated by international financial activity. Cross-border flows of funds can be large and volatile because the financial markets are large and because the flows are influenced by changing financial market conditions as well as by changes in…
U.S. Virgin Islands' Economy Grew 2.9 Percent in 2010
The economy of the U.S. Virgin Islands returned to growth in 2010, expanding 2.9 percent, according to new data from the Bureau of Economic Analysis (BEA). The growth in real gross domestic product (GDP) largely reflected increases in the trade surplus, government spending, and construction.
GDP offers the most comprehensive picture of the territory’s economy. Although more timely indicators like employment, wages, and visitor…
U.S. Virgin Islands (USVI) Gross Domestic Product, 2010
This release is available as a PDF download.
BEA Regional Data Used to Distribute Federal Funds to State, Local Governments
Did you know that Bureau of Economic Analysis (BEA) regional economic statistics, such as the annual state personal income statistics released September 25, 2012, are used to allocate billions of dollars in federal funds to state and local governments?
In fiscal year 2011, more than $339 billion in federal funds were distributed under programs using U.S. Bureau of Economic Analysis statistics in funding formulas.
August 2012 Trade Gap is $44.2 Billion
The U.S. monthly international trade deficit increased in August 2012, according to the U.S. Bureau of Economic Analysis and the U.S. Census Bureau. The deficit increased from $42.5 billion (revised) in July to $44.2 billion in August, as exports decreased more than imports. The previously published July deficit was $42.0 billion. The goods deficit increased $1.5 billion from July to $59.3 billion in August, and the services surplus decreased…
BEA Updates Tool Used by Investors, Planners; Here's How RIMS II Works
The Bureau of Economic Analysis (BEA) updated its Regional Input-Output Modeling System (RIMS II), a tool used by investors, regional planners, and government officials to gauge the impact of a change in economic activity on a local community or a particular region of the country. The update incorporates new information from both BEA’s industry and regional economic accounts.
Real Consumer Spending Slows in August
Personal income increased 0.1 percent in August, the same increase as in July.
Wages and salaries, the largest component of personal income, increased 0.1 percent in August after increasing 0.1 percent in July. Government social benefits to persons turned down in August.
Personal Income and Outlays, August 2012
Personal income increased $15.0 billion, or 0.1 percent, and disposable personal income (DPI) increased $12.5 billion, or 0.1 percent, inAugust, according to the Bureau of Economic Analysis. Personal consumption expenditures (PCE) increased $57.2 billion, or 0.5 percent. In July, personal income increased $18.5 billion, or 0.1 percent, DPI increased $15.4 billion, or 0.1 percent, and PCE increased $45.4 billion, or 0.4 percent, based on…


