Bureau of Economic Analysis
U.S. International Investment Position, 2nd Quarter 2025
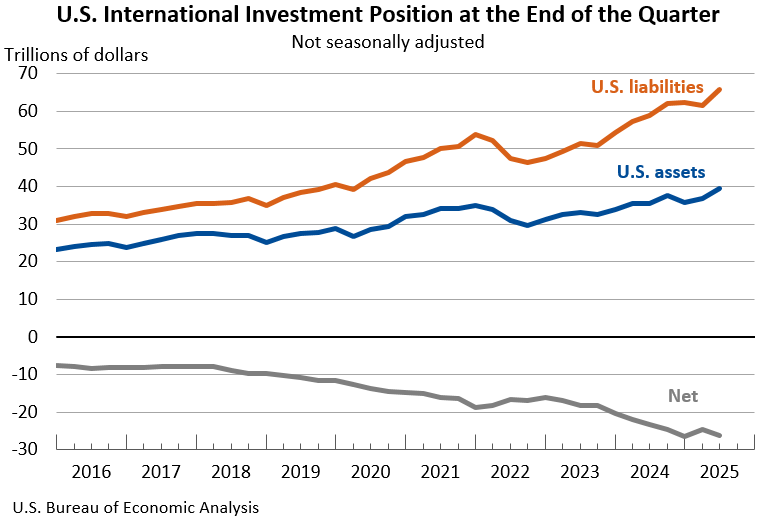
The U.S. net international investment position, the difference between U.S. residents’ foreign financial assets and liabilities, was -$26.14 trillion at the end of the second quarter of 2025, according to statistics released today by the U.S. Bureau of Economic Analysis. Assets totaled $39.56 trillion, and liabilities were $65.71 trillion. At the end of the first quarter, the net investment position was -$24.65 trillion (revised).
Principal Federal Economic Indicators
Noteworthy
The Latest
BEA Operational Improvements Enable Agency to Publish More Regional Economic Statistics
Operational improvements at the Bureau of Economic Analysis (BEA) mean the public will soon get to see more regional economic data. These improvements will safeguard businesses’ private information, while ensuring vital regional data is available to policy makers and other data users. BEA is constantly looking at ways to better provide the information that users need while protecting the confidentiality of employers’ records.
BEA Adds More Open Data to API
Developers, do you want to bring more detailed economic data to your next app? The Bureau of Economic Analysis (BEA) recently added several data sets to the application programming interface (API) we launched last year.
The API now provides direct access to the gross domestic product (GDP) underlying detail tables. Those tables contain a wealth of statistics, including how much consumers spend on hundreds of items like furnishings,…
October 2014 Trade Gap is $43.4 Billion
The U.S. monthly international trade deficit decreased in October 2014 according to the U.S. Bureau of Economic Analysis and the U.S. Census Bureau. The deficit decreased from $43.6 billion in September (revised) to $43.4 billion in October, as exports increased more than imports. The previously published September deficit was $43.0 billion. The goods deficit increased less than $0.1 billion from September to $62.7 billion in October. The…
Real Consumer Spending Increases in October
Personal income rose 0.2 percent in October, the same increase as in September. Wages and salaries, the largest component of personal income, rose 0.3 percent in October after rising 0.2 percent in September.
Current-dollar disposable personal income (DPI), after-tax income, rose 0.2 percent in October after rising 0.1 percent in September.
Real DPI, income adjusted for taxes and inflation, increased…
Personal Income and Outlays, October 2014
Personal income increased $32.9 billion, or 0.2 percent, and disposable personal income (DPI) increased $23.4 billion, or 0.2 percent, in October, according to the Bureau of Economic Analysis. Personal consumption expenditures (PCE) increased $27.3 billion, or 0.2 percent. In September, personal income increased $24.6 billion, or 0.2 percent, DPI increased $17.2 billion, or 0.1 percent, and PCE increased $4.1 billion, or less than 0.1 percent…
GDP Increases in Third Quarter
Real gross domestic product (GDP) increased 3.9 percent in the third quarter of 2014, according to the “second” estimate released by the Bureau of Economic Analysis. In the second quarter, real GDP increased 4.6 percent.
Third-quarter highlights The increase in GDP in the third quarter reflected the following:
Gross Domestic Product, 3rd quarter 2014 (second estimate); Corporate Profits, 3rd quarter 2014 (preliminary estimate)
Real gross domestic product -- the value of the production of goods and services in the United States, adjusted for price changes -- increased at an annual rate of 3.9 percent in the third quarter of 2014, according to the "second" estimate released by the Bureau of Economic Analysis. In the second quarter, real GDP increased 4.6 percent. The GDP estimate released today is based on more complete source data than were available…
BEA is Launching the Survey of New Foreign Direct Investment (BE-13)!
The BE-13 survey captures information about new investments made when a foreign investor establishes or acquires a U.S. business (either directly, or indirectly through a U.S. business it already owns) or expands an existing U.S. business.
The data collected in the survey will help in assessing the impact of foreign direct investment on the U.S. economy, in advising foreign investors seeking to invest in the United States, and in…
Activities of U.S. Affiliates of Foreign Multinational Enterprises in 2012
The Bureau of Economic Analysis (BEA) has released preliminary statistics on the activities of U.S. affiliates of foreign multinational enterprises (MNEs) in 2012. These statistics are based on the results of the 2012 Benchmark Survey of Foreign Direct Investment in the United States (“inward” direct investment.)
These statistics cover the finances and operations of U.S. affiliates of foreign MNEs—including balance sheet and income…


