Bureau of Economic Analysis
U.S. International Investment Position, 2nd Quarter 2025
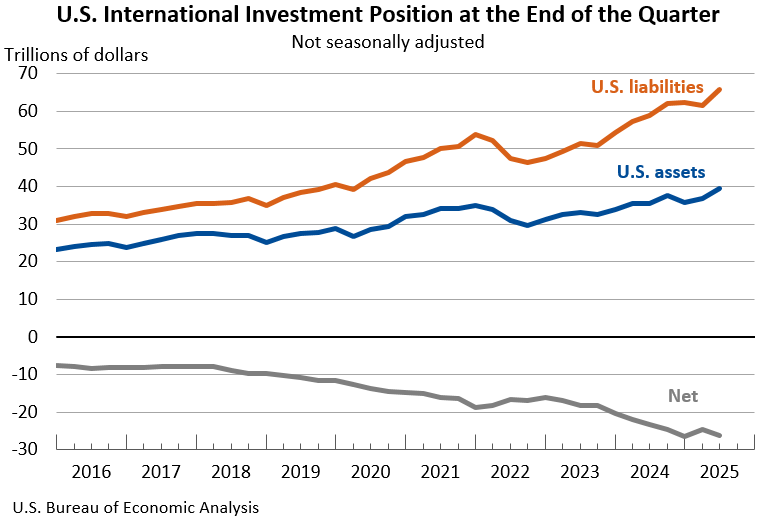
The U.S. net international investment position, the difference between U.S. residents’ foreign financial assets and liabilities, was -$26.14 trillion at the end of the second quarter of 2025, according to statistics released today by the U.S. Bureau of Economic Analysis. Assets totaled $39.56 trillion, and liabilities were $65.71 trillion. At the end of the first quarter, the net investment position was -$24.65 trillion (revised).
Principal Federal Economic Indicators
Noteworthy
The Latest
GDP Growth Slows In Fourth Quarter
Real gross domestic product (GDP) increased 2.6 percent in the fourth quarter of 2013, according to the “third” estimate released by the Bureau of Economic Analysis. The growth rate was 0.2 percentage point more than the “second” estimate released in February. In the third quarter, the growth rate was 4.1 percent.
Gross Domestic Product, 4th quarter and annual 2013 (third estimate); Corporate Profits, 4th quarter and annual 2013
Real gross domestic product -- the output of goods and services produced by labor and property located in the United States -- increased at an annual rate of 2.6 percent in the fourth quarter of 2013 (that is, from the third quarter to the fourth quarter), according to the "third" estimate released by the Bureau of Economic Analysis. In the third quarter, real GDP increased 4.1 percent. The GDP estimate released today is based on…
Value of Both Foreign Investments in the United States and U.S. Investments Abroad Increased in Fourth Quarter 2013
The U.S. net international investment position was -$4,577.5 billion (preliminary) at the end of the fourth quarter of 2013 as the value of foreign investments in the United States exceeded the value of U.S. investments abroad. At the end of the third quarter, the net position was -$4,171.8 billion (revised).
Value of Both Foreign Investments in the United States and U.S. Investments Abroad Increased in 2013
The U.S. net international investment position was -$4,577.5 billion (preliminary) at the end of 2013 as the value of foreign investments in the United States exceeded the value of U.S. investments abroad. At the end of 2012, the net position was -$3,863.9 billion.
The $713.6 billion decrease in the net position from the end of 2012 to the end of 2013 reflected a $1,039.8 billion increase in the value of foreign-owned assets in the…
U.S. International Investment Position, 4th quarter and year 2013
Comprehensive Restructuring of the U.S. International Economic Accounts
On June 30, 2014, BEA will release "U.S. Net International Investment Position: End of the First Quarter 2014, Year 2013, and Annual Revisions." The statistics will be revised to reflect newly available and more complete source data, changes in estimation methods, and changes in definitions and classifications.
State Personal Income: Fourth Quarter 2013
State personal income growth slowed to 0.6 percent in the fourth quarter of 2013, from 1.0 percent in the third quarter. Growth ranged from 1.2 percent in Texas to -0.6 percent in Iowa. The fourth-quarter personal income decline in Iowa and six other states reflected lower crop prices, which reduced the value of farm output and farm earnings. The inflation rate slowed to 0.3 percent in the fourth quarter from 0.5 percent in the third…
State Personal Income 2013
Average state personal income growth slowed to 2.6 percent in 2013 from 4.2 percent in 2012. State personal income growth ranged from 1.5 percent in West Virginia to 7.6 percent in North Dakota, with every state growing more slowly in 2013 than in 2012. Inflation, as measured by the national price index for personal consumption expenditures, slowed to 1.1 percent in 2013 from 1.8 percent in 2012.
See the full report.
Restoration of Previously Eliminated Local Area Personal Income Statistics
The Bureau of Economic Analysis (BEA) will restore a portion of the statistical detail to its Local Area Personal Income (LAPI) program that had been eliminated due to sequestration and reduced funding levels in FY 2013.
In early May, BEA will release for 2001-2012 (1) local area employment statistics; (2) local area industry detail for compensation and earnings for 108 industries; (3) detail on farm income and expenses; (4) and…
State Quarterly Personal Income, 1st quarter 2013-4th quarter 2013; State Annual Personal Income, 2013 (preliminary estimates)
Average state personal income growth slowed to 2.6 percent in 2013 from 4.2 percent in 2012, according to estimates released today by the U.S. Bureau of Economic Analysis. State personal income growth ranged from 1.5 percent in West Virginia to 7.6 percent in North Dakota, with every state growing more slowly in 2013 than in 2012. Inflation, as measured by the national price index for personal consumption expenditures, slowed to 1.1 percent…
BEA Director Steve Landefeld to Retire
Steve Landefeld, Director of the U.S. Bureau of Economic Analysis, plans to retire in early May. Dr. Landefeld took the helm in May 1995 and in his 19 years as director was instrumental in implementing major changes aimed at better measuring the dynamic U.S. and world economies.
Under Dr. Landefeld’s leadership, the non-partisan BEA:


