Bureau of Economic Analysis
U.S. International Investment Position, 2nd Quarter 2025
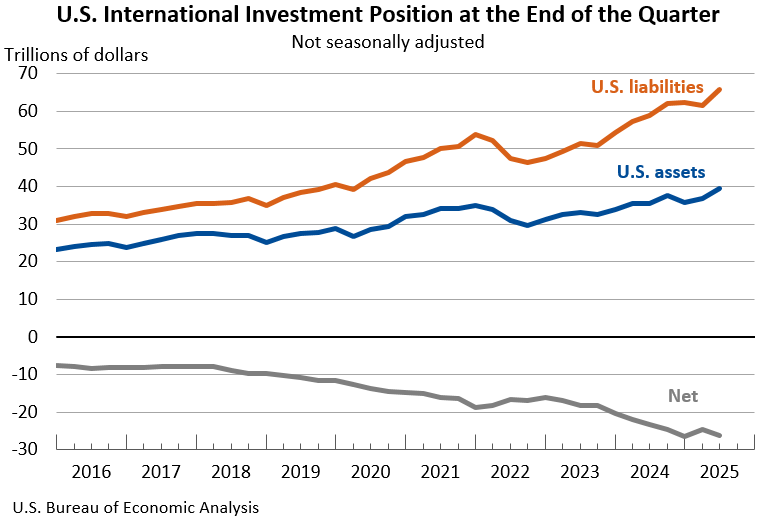
The U.S. net international investment position, the difference between U.S. residents’ foreign financial assets and liabilities, was -$26.14 trillion at the end of the second quarter of 2025, according to statistics released today by the U.S. Bureau of Economic Analysis. Assets totaled $39.56 trillion, and liabilities were $65.71 trillion. At the end of the first quarter, the net investment position was -$24.65 trillion (revised).
Principal Federal Economic Indicators
Noteworthy
The Latest
Gross Domestic Product, First Quarter 2019 (Third Estimate); Corporate Profits, First Quarter 2019 (Revised Estimate)
Real gross domestic product (GDP) increased at an annual rate of 3.1 percent in the first quarter of 2019 (table 1), according to the "third" estimate released by the Bureau of Economic Analysis. In the fourth quarter of 2018, real GDP increased 2.2 percent. Profits from current production (corporate profits with inventory valuation and capital consumption adjustments) decreased $59.3 billion in the first quarter, compared with a…
U.S. Net International Investment Position – First Quarter 2019
The U.S. net international investment position decreased to –$9.93 trillion (preliminary) at the end of the first quarter of 2019 from –$9.55 trillion (revised) at the end of the fourth quarter of 2018. The $374.4 billion decrease reflected net financial transactions of –$30.2 billion and net other changes in position, such as price and exchange-rate changes, of –$344.2 billion.
U.S. Net International Investment Position: First Quarter 2019, Year 2018, and Annual Update
The U.S. net international investment position decreased to -$9.93 trillion (preliminary) at the end of the first quarter of 2019 from -$9.55 trillion (revised) at the end of the fourth quarter of 2018, according to statistics released by the Bureau of Economic Analysis (BEA).
State Personal Income, First Quarter 2019
State personal income increased 3.4 percent at an annual rate in the first quarter of 2019, a deceleration from the 4.1 percent increase in the fourth quarter of 2018. Personal income increased in all states except South Dakota. The percent change in personal income across all states ranged from 5.6 percent in West Virginia to -0.6 percent in South Dakota.
U.S. Current-Account Deficit Decreases in First Quarter 2019
The U.S. current-account deficit decreased to $130.4 billion (preliminary) in the first quarter of 2019 from $143.9 billion (revised) in the fourth quarter of 2018. As a percentage of U.S. gross domestic product, the deficit decreased to 2.5 percent from 2.8 percent. The previously published current-account deficit for the fourth quarter was $134.4 billion.
U.S. International Transactions, First Quarter 2019 and Annual Update
The U.S. current-account deficit decreased to $130.4 billion (preliminary) in the first quarter of 2019 from $143.9 billion (revised) in the fourth quarter of 2018. As a percentage of U.S. gross domestic product, the deficit decreased to 2.5 percent from 2.8 percent. The previously published current-account deficit for the fourth quarter was $134.4 billion.
BEA Joins the FSRDC Network: New Secure Locations Now Available for Researchers
For the first time, approved academics and other researchers will be able to access the Bureau of Economic Analysis’ confidential, company-specific trade and investment data from secure locations around the country, making it more convenient for them to do research.
April 2019 Trade Gap is $50.8 Billion
The U.S. monthly international trade deficit decreased in April 2019 according to the U.S. Bureau of Economic Analysis and the U.S. Census Bureau. The deficit decreased from $51.9 billion in March (revised) to $50.8 billion in April, as imports decreased more than exports. The previously published March deficit was $50.0 billion. The goods deficit decreased $1.0 billion in April to $71.7 billion. The services surplus increased $0.1 billion in…
U.S. International Trade in Goods and Services, April 2019
The U.S. monthly international trade deficit decreased in April 2019 according to the U.S. Bureau of Economic Analysis and the U.S. Census Bureau. The deficit decreased from $51.9 billion in March (revised) to $50.8 billion in April, as imports decreased more than exports. The previously published March deficit was $50.0 billion. The goods deficit decreased $1.0 billion in April to $71.7 billion. The services surplus increased $0.1 billion in…


