Bureau of Economic Analysis
U.S. International Trade in Goods and Services, June 2025
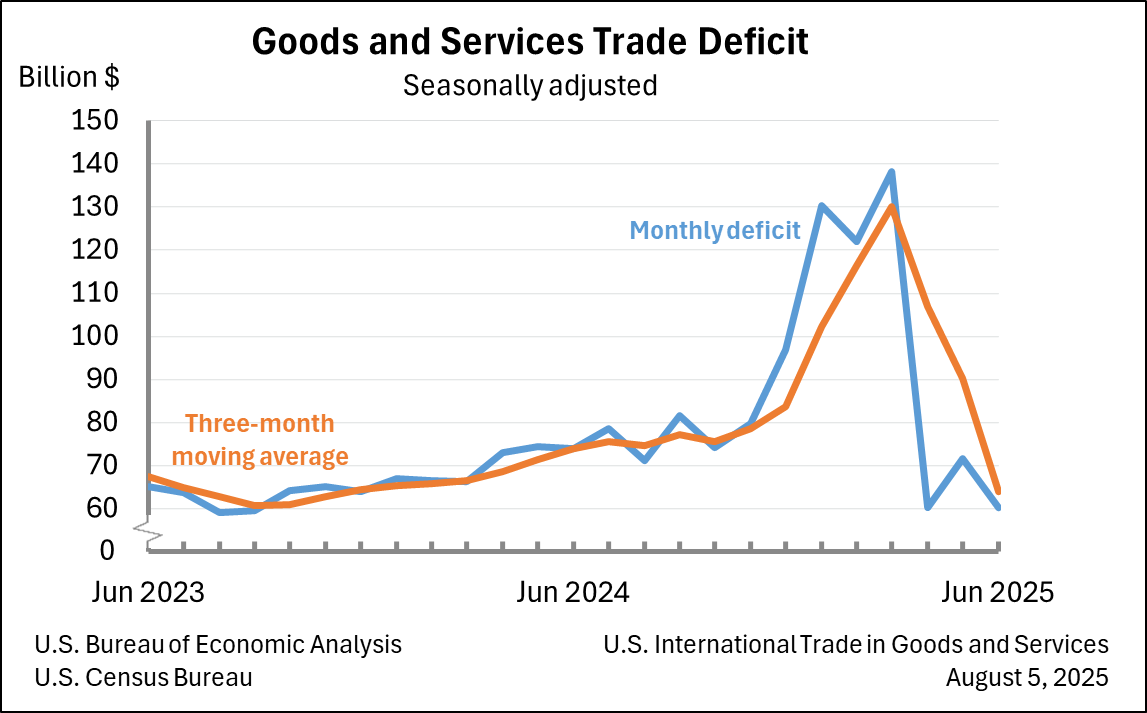
The U.S. goods and services trade deficit decreased in June 2025 according to the U.S. Bureau of Economic Analysis and the U.S. Census Bureau. The deficit decreased from $71.7 billion in May (revised) to $60.2 billion in June, as exports decreased less than imports. The goods deficit decreased $11.4 billion in June to $85.9 billion. The services surplus increased $0.1 billion in June to $25.7 billion.
Principal Federal Economic Indicators
Noteworthy
- 2025 News Release Schedule
- Innovation at BEA
- 2025 Annual Updates
- New! Services Trade Data for More Countries
- Data Tool: Trade in Value Added
- Distribution of State Personal Income
- Updated: RIMS II Regional Multipliers
- Arts and Culture
- Space Economy
- FDI Now in State BEARFACTS
- Quick Guide: Price Indexes
The Latest
Activities of U.S. Affiliates of Foreign Multinational Enterprises, 2019
Majority-owned U.S. affiliates (MOUSAs) of foreign multinational enterprises(MNEs) employed7.95 million workers in the United States in 2019, a 1.1 percent increase from 7.86 million in 2018, according to the Bureau of Economic Analysis. MOUSAs accounted for 6.0 percent of total private-industry employment in the United States in 2019.
Getting to Know BEA’s International Statistics
Did the U.S. current account deficit grow or shrink last year? What products make up the largest share of U.S. goods exports? What types of assets make up the largest portion of U.S. financial investments abroad? In which state do U.S. affiliates of foreign multinational enterprises employ the most people?
U.S. International Trade in Goods and Services, June 2021
The U.S. monthly international trade deficit increased in June 2021 according to the U.S. Bureau of Economic Analysis and the U.S. Census Bureau. The deficit increased from $71.0 billion in May (revised) to $75.7 billion in June, as imports increased more than exports. The previously published May deficit was $71.2 billion. The goods deficit increased $4.0 billion in June to $93.2 billion. The services surplus decreased $0.7 billion in June to…
June 2021 Trade Gap is $75.7 Billion
The U.S. monthly international trade deficit increased in June 2021 according to the U.S. Bureau of Economic Analysis and the U.S. Census Bureau. The deficit increased from $71.0 billion in May (revised) to $75.7 billion in June, as imports increased more than exports. The previously published May deficit was $71.2 billion. The goods deficit increased $4.0 billion in June to $93.2 billion. The services surplus decreased $0.7 billion in June…
Personal Income and Outlays, June 2021
Personal income increased $26.1 billion, or 0.1 percent at a monthly rate, while consumer spending increased $155.4 billion, or 1.0 percent, in June. Compensation increased in June while pandemic related assistance programs declined. In addition to presenting estimates for June 2021, these highlights provide comparisons to February 2020, the last month before the onset of the COVID-19 pandemic in the United States. For more information, see…
Personal Income and Outlays, June 2021 and Annual Update
Personal income increased $26.1 billion, or 0.1 percent at a monthly rate, while consumer spending increased $155.4 billion, or 1.0 percent, in June. Compensation increased in June while pandemic-related assistance programs declined.
Gross Domestic Product, Second Quarter 2021 (Advance Estimate) and Annual Update
Real gross domestic product (GDP) increased at an annual rate of 6.5 percent in the second quarter of 2021, reflecting the continued economic recovery, reopening of establishments, and continued government response related to the COVID-19 pandemic. In the second quarter, government assistance payments in the form of loans to businesses and grants to state and local governments increased, while social benefits to households, such as the direct…
Direct Investment by Country and Industry, 2020
The U.S. direct investment abroad position, or cumulative level of investment, increased $244.9 billion to $6.15 trillion at the end of 2020 from $5.91 trillion at the end of 2019, according to statistics released by the Bureau of Economic Analysis (BEA). The increase reflected a $158.8 billion increase in the position in Europe, primarily in the United Kingdom and the Netherlands. By industry, holding company affiliates owned by U.S.…


