Notice
Due to a lapse in appropriations, this website is not being updated.
Bureau of Economic Analysis
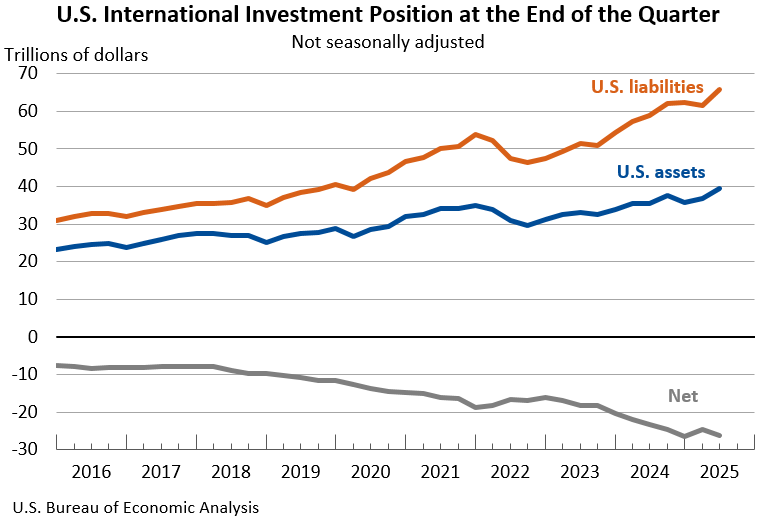
U.S. International Investment Position, 2nd Quarter 2025
The U.S. net international investment position, the difference between U.S. residents’ foreign financial assets and liabilities, was -$26.14 trillion at the end of the second quarter of 2025, according to statistics released today by the U.S. Bureau of Economic Analysis. Assets totaled $39.56 trillion, and liabilities were $65.71 trillion. At the end of the first quarter, the net investment position was -$24.65 trillion (revised).
Principal Federal Economic Indicators
Noteworthy
The Latest
State Personal Income: Fourth Quarter 2012
In the fourth quarter of 2012, average state personal income growth accelerated to 1.9 percent from 0.6 percent in the third quarter, the fastest pace since the first quarter of 2011. Fourth-quarter growth ranged from 1.3 percent in West Virginia to 4.8 percent in South Dakota. The inflation rate was 0.4 percent in the fourth quarter of 2012, the same as in the third quarter.
For more on state personal income, see the full report…
State Quarterly Personal Income, 1st quarter 2012-4th quarter 2012 and State Annual Personal Income, 2012 (preliminary estimates)
WASHINGTON DC, March 27, 2013 - Average state personal income growth slowed to 3.5 percent in 2012 from 5.2 percent in 2011, according to estimates released today by the U.S. Bureau of Economic Analysis. State personal income growth ranged from -0.2 percent in South Dakota to 12.4 percent in North Dakota. Inflation, as measured by the national price index for personal consumption expenditures, fell to 1.8 percent in 2012 from 2.4 percent in…
Fourth Quarter 2012 U.S. Net International Investment Position
The U.S. net international investment position was –$4,416.2 billion (preliminary) at the end of the fourth quarter of 2012 compared with –$4,663.4 billion at the end of the third quarter as the value of foreign investments in the United States exceeded the value of U.S. investments abroad.
U.S. International Investment Position, 4th quarter and year 2012
Newly-Available Statistics
In this release, BEA introduces new U.S. international investment position statistics on a quarterly basis. The new statistics are available for the fourth quarter of 2005 through the fourth quarter of 2012. Previously-published yearend positions are not revised.
BEA to Release Quarterly Global Investment Reports
A more up-to-date picture of the value of what the United States owns abroad compared to what foreign investors own in this country will debut March 26 when the Bureau of Economic Analysis (BEA) releases its first quarterly estimates of the U.S. international investment position. That release will feature statistics for the end of 2012 as well as quarterly data back to the fourth quarter of 2005.
Travel and Tourism Spending Accelerated in 4th Quarter 2012
Real Tourism Spending. Real spending on “traveler accommodations” accelerated, increasing 9.4 percent in the fourth quarter of 2012 after increasing 5.3 percent in the third quarter. Real spending on “food services and drinking places” also accelerated, increasing 8.6 percent in the fourth quarter after increasing 0.6 percent in the third quarter.
Travel and Tourism Satellite Accounts, 4th quarter and annual 2012
Real spending on travel and tourism turned up in the fourth quarter of 2012, increasing at an annual rate of 1.8 percent after decreasing 0.7 percent (revised) in the third quarter. By comparison, growth in real gross domestic product (GDP) increased 0.1 percent (second estimate) in the fourth quarter of 2012 after increasing 3.1 percent in the third quarter. For the year, real spending on travel and tourism increased 2.7 percent in 2012…
U.S. Current-Account Deficit Increases in 2012
The U.S. current-account deficit—the combined balances on trade in goods and services, income, and net unilateral current transfers—increased to $475.0 billion (preliminary) in 2012 from $465.9 billion in 2011. As a percentage of U.S. gross domestic product, the deficit decreased to 3.0 percent in 2012 from 3.1 percent in 2011.
U.S. Current-Account Deficit Decreases in Fourth Quarter 2012
The U.S. current-account deficit—the combined balances on trade in goods and services, income, and net unilateral current transfers—decreased to $110.4 billion (preliminary) in the fourth quarter of 2012 from $112.4 billion (revised) in the third quarter of 2012. As a percentage of U.S. gross domestic product, the deficit remained at 2.8 percent. The previously published current-account deficit for the third quarter was $107.5 billion.
U.S. International Transactions, 4th quarter and Year 2012
Sarah Scott: (202) 606-9286 Paul W. Farello: (202) 606-9561 (Revisions) The U.S. current-account deficitthe combined balances on trade in goods and services, income, and net unilateral current transfersdecreased to $110.4 billion (preliminary) in the fourth quarter from $112.4 billion (revised) in the third quarter. The decrease in the current- account deficit was accounted for by increases in…


