Bureau of Economic Analysis
U.S. International Trade in Goods and Services, June 2025
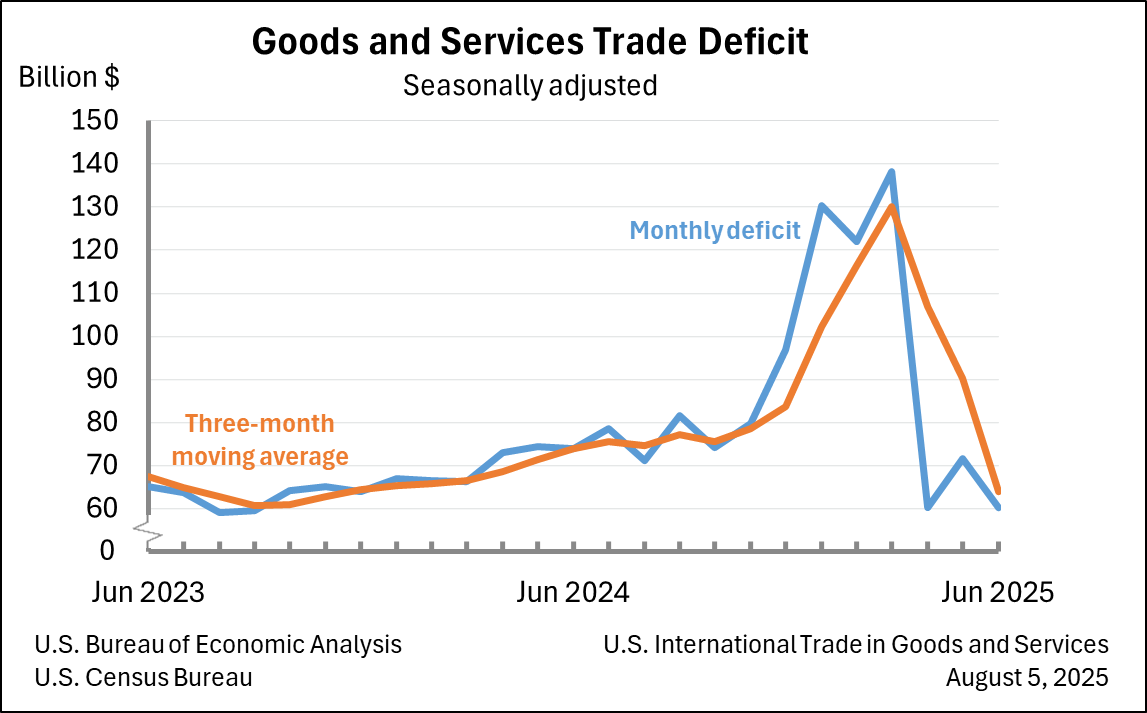
The U.S. goods and services trade deficit decreased in June 2025 according to the U.S. Bureau of Economic Analysis and the U.S. Census Bureau. The deficit decreased from $71.7 billion in May (revised) to $60.2 billion in June, as exports decreased less than imports. The goods deficit decreased $11.4 billion in June to $85.9 billion. The services surplus increased $0.1 billion in June to $25.7 billion.
Principal Federal Economic Indicators
Noteworthy
- 2025 News Release Schedule
- Innovation at BEA
- 2025 Annual Updates
- New! Services Trade Data for More Countries
- Data Tool: Trade in Value Added
- Distribution of State Personal Income
- Updated: RIMS II Regional Multipliers
- Arts and Culture
- Space Economy
- FDI Now in State BEARFACTS
- Quick Guide: Price Indexes
The Latest
GDP Increases in Third Quarter
Real gross domestic product (GDP) increased 3.0 percent in the third quarter of 2017, according to the “advance” estimate released by the Bureau of Economic Analysis. In the second quarter of 2017, real GDP increased 3.1 percent.
GDP highlightsThe increase in real GDP reflected increases in consumer spending, inventory investment, business investment, and exports. A notable offset to these increases was a decrease in housing…
Gross Domestic Product, 3rd quarter 2017 (advance estimate)
Real gross domestic product (GDP) increased at an annual rate of 3.0 percent in the third quarter of 2017 (table 1), according to the "advance" estimate released by the Bureau of Economic Analysis. In the second quarter, real GDP increased 3.1 percent. The Bureau emphasized that the third-quarter advance estimate released today is based on source data that are incomplete or subject to further revision by the source agency (see “Source Data for…
Gross Domestic Product for the Commonwealth of the Northern Mariana Islands (CNMI), 2016
This release is available as a PDF download.
CNMI GDP Increases in 2016
Today, the Bureau of Economic Analysis is releasing estimates of gross domestic product for the Commonwealth of the Northern Mariana Islands for 2016, in addition to estimates of GDP by industry and compensation by industry for 2015. These estimates were developed under the Statistical Improvement Program funded by the Office of Insular Affairs of the U.S. Department of the Interior.
Revised estimates of GDP for 2013 to 2015, as well…
August 2017 Trade Gap is $42.4 Billion
The U.S. monthly international trade deficit decreased in August 2017 according to the U.S. Bureau of Economic Analysis and the U.S. Census Bureau. The deficit decreased from $43.6 billion in July (revised) to $42.4 billion in August, as exports increased and imports decreased. The previously published July deficit was $43.7 billion. The goods deficit decreased $0.9 billion in August to $64.4 billion. The services surplus increased $0.3…
U.S. International Trade in Goods and Services, August 2017
Total August exports of $195.3 billion and imports of $237.7 billion resulted in a goods and services deficit of $42.4 billion.
Personal Consumption Expenditures by State, 2016
State personal consumption expenditures (PCE) grew on average 4.0 percent in 2016, the same rate as in 2015. In 2016, PCE growth ranged from 0.2 percent in North Dakota to 6.2 percent in Utah.
Personal Consumption Expenditures by State, 2016
State personal consumption expenditures (PCE) grew on average 4.0 percent in 2016, the same rate as in 2015. In 2016, PCE growth ranged from 0.2 percent in North Dakota to 6.2 percent in Utah.
Spending on Durable Goods Falls in August
Personal income increased 0.2 percent in August after increasing 0.3 percent in July. Wages and salaries, the largest component of personal income, was unchanged in August after increasing 0.5 percent in July.
Personal Income and Outlays, August 2017
In August 2017, real disposable personal income decreased 0.1 percent.


