Bureau of Economic Analysis
U.S. International Investment Position, 2nd Quarter 2025
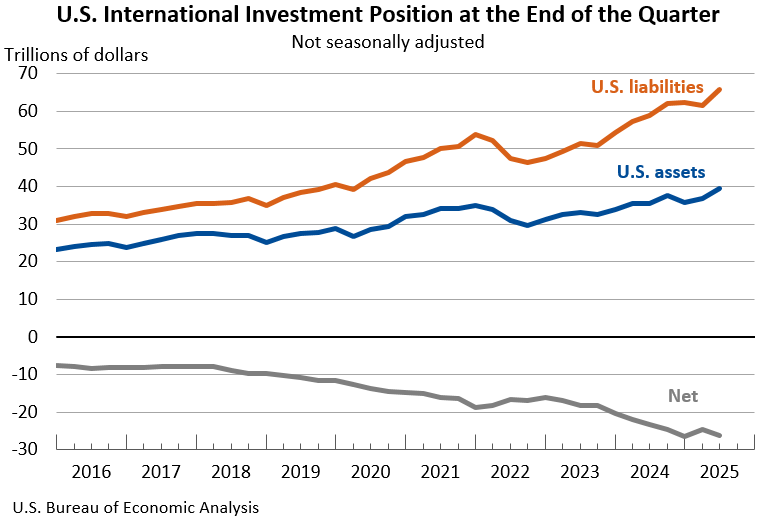
The U.S. net international investment position, the difference between U.S. residents’ foreign financial assets and liabilities, was -$26.14 trillion at the end of the second quarter of 2025, according to statistics released today by the U.S. Bureau of Economic Analysis. Assets totaled $39.56 trillion, and liabilities were $65.71 trillion. At the end of the first quarter, the net investment position was -$24.65 trillion (revised).
Principal Federal Economic Indicators
Noteworthy
The Latest
Activities of U.S. Affiliates of Foreign Multinational Enterprises in 2012
The Bureau of Economic Analysis (BEA) has released preliminary statistics on the activities of U.S. affiliates of foreign multinational enterprises (MNEs) in 2012. These statistics are based on the results of the 2012 Benchmark Survey of Foreign Direct Investment in the United States (“inward” direct investment.)
These statistics cover the finances and operations of U.S. affiliates of foreign MNEs—including balance sheet and income…
Local Area Personal Income: 2013
Personal income grew in 2013 in 2,695 counties, fell in 390, and was unchanged in 28. On average, personal income rose 2.0 percent in 2013 in the metropolitan portion of the United States and rose 2.1 percent in the nonmetropolitan portion. The metropolitan and nonmetropolitan portions grew 5.3 percent and 4.4 percent, respectively, in 2012. The percent change from 2012 to 2013 in personal income ranged from -35.0 percent in Lamoure County,…
Local Area Personal Income, 2011-2013
Personal income grew in 2013 in 2,695 counties, fell in 390, and was unchanged in 28, according to estimates released today by the U.S. Bureau of Economic Analysis. On average, personal income rose 2.0 percent in 2013 in the metropolitan portion of the United States and rose 2.1 percent in the nonmetropolitan portion. The metropolitan and nonmetropolitan portions grew 5.3 percent and 4.4 percent, respectively, in 2012.
Guam's Economy Grew 0.6 Percent in 2013
Newly published estimates of gross domestic product for Guam show that real GDP – GDP adjusted to remove price changes – increased 0.6 percent in 2013.
New BEA Data Provide Entrepreneurs with a Fortune 500 Research Department
Is consumer spending growing faster in North Dakota or North Carolina? How do consumers in different regions respond to economic downturns? Which state has the fastest growing consumer market for motor vehicles?
Gross Domestic Product for the Commonwealth of the Northern Mariana Islands (CNMI), 2013
This release is available as a PDF download.
Widespread Industry Growth Drives Upturn in GDP in Second Quarter
Widespread industry growth drove the U.S. economy’s second-quarter rebound, with 19 of the 22 industry groups tracked contributing 6.7 percentage points to real Gross Domestic Product. Finance, insurance, real estate, rental and leasing; manufacturing; and agriculture, forestry, fishing and hunting led the way.
Real GDP increased 4.6 percent in the second quarter, after decreasing 2.1 percent in the first quarter.
Northern Mariana Islands' Economy Grew 4.4 Percent in 2013
Newly published estimates of gross domestic product for the Commonwealth of the Northern Mariana Islands (CNMI) show that real GDP – GDP adjusted to remove price changes – increased 4.4 percent in 2013.
Widespread Growth Across Industries in Second Quarter 2014
Real gross domestic product (GDP) increased at an annual rate of 4.6 percent in the second quarter of 2014, after decreasing 2.1 percent in the first quarter. Both private goods- and services-producing industries contributed to the increase, while the government sector decreased.


