Bureau of Economic Analysis
New Foreign Direct Investment in the United States, 2024
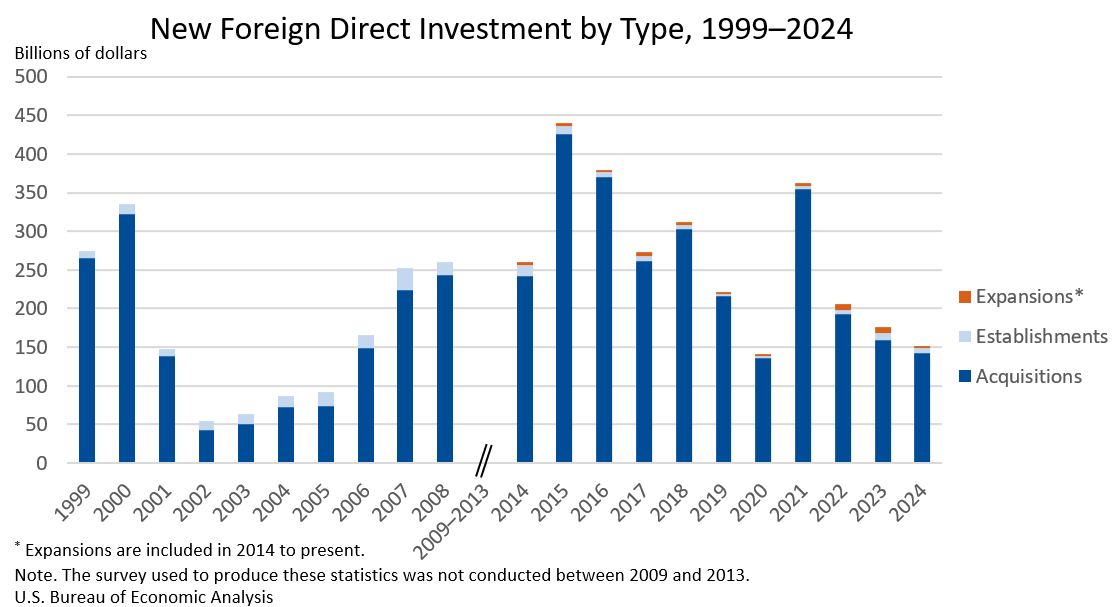
Expenditures by foreign direct investors to acquire, establish, or expand U.S. businesses totaled $151.0 billion in 2024, according to preliminary statistics released today by the U.S. Bureau of Economic Analysis. Expenditures decreased $24.9 billion, or 14.2 percent, from $176.0 billion (revised) in 2023 and were below the annual average of $277.2 billion for 2014–2023. As in previous years, acquisitions of existing U.S. businesses accounted for most of the expenditures.
Principal Federal Economic Indicators
Noteworthy
- 2025 News Release Schedule
- Innovation at BEA
- 2025 Annual Updates
- New! Services Trade Data for More Countries
- Data Tool: Trade in Value Added
- Distribution of State Personal Income
- Updated: RIMS II Regional Multipliers
- Arts and Culture
- Space Economy
- FDI Now in State BEARFACTS
- Quick Guide: Price Indexes
The Latest
Personal Income and Outlays, November 2023
Personal income increased $81.6 billion (0.4 percent at a monthly rate) in November. Disposable personal income (DPI)—personal income less personal current taxes—increased $71.9 billion (0.4 percent). Personal outlays—the sum of personal consumption expenditures (PCE), personal interest payments, and personal current transfer payments—increased $47.8 billion (0.2 percent) and consumer spending increased $46.7 billion (0.2 percent). Personal…
Gross Domestic Product (Third Estimate) Corporate Profits (Revised Estimate) and GDP by Industry, Third Quarter 2023
Real gross domestic product (GDP) increased at an annual rate of 4.9 percent in the third quarter of 2023, according to the “third” estimate. In the second quarter, real GDP increased 2.1 percent. The increase in the third quarter primarily reflected increases in consumer spending and inventory investment. Imports, which are a subtraction in the calculation of GDP, increased.
Gross Domestic Product (Third Estimate), Corporate Profits (Revised Estimate), and GDP by Industry, Third Quarter 2023
Real gross domestic product (GDP) increased at an annual rate of 4.9 percent in the third quarter of 2023, according to the “third” estimate. In the second quarter, real GDP increased 2.1 percent. The increase in the third quarter primarily reflected increases in consumer spending and inventory investment. Imports, which are a subtraction in the calculation of GDP, increased. Profits increased 3.4 percent at a quarterly rate in the third…
U.S. Current-Account Deficit Narrows in 3rd Quarter 2023
The U.S. current-account deficit, which reflects the combined balances on trade in goods and services and income flows between U.S. residents and residents of other countries, narrowed by $16.5 billion, or 7.6 percent, to $200.3 billion in the third quarter of 2023. The narrowing mostly reflected a reduced deficit on goods. The third-quarter deficit was 2.9 percent of current-dollar gross domestic product, down from 3.2 percent in the second…
U.S. International Transactions, 3rd Quarter 2023
The U.S. current-account deficit narrowed by $16.5 billion, or 7.6 percent, to $200.3 billion in the third quarter of 2023, according to statistics released today by the U.S. Bureau of Economic Analysis. The revised second-quarter deficit was $216.8 billion. The third-quarter deficit was 2.9 percent of current-dollar gross domestic product, down from 3.2 percent in the second quarter.
Real Personal Consumption Expenditures by State and Real Personal Income by State and Metropolitan Area, 2022
Real personal consumption expenditures (PCE) by state increased in 42 states and the District of Columbia in 2022, with the percent change ranging from 5.7 percent in Alaska to –3.2 percent in New Hampshire.
Real personal income declined in 45 states and the District of Columbia in 2022, with the percent change ranging from 3.0 percent in North Dakota to –8.9 percent in Rhode Island.
Real Personal Consumption Expenditures by State and Real Personal Income by State and Metropolitan Area, 2022
Real personal consumption expenditures (PCE) by state increased in 42 states and the District of Columbia in 2022, with the percent change ranging from 5.7 percent in Alaska to –3.2 percent in New Hampshire.
Musings from Mackinac Bridge: Three Ways to Measure Economy Offer Different Perspectives
A blog post from BEA Director Vipin Arora
Mackinac Bridge—which connects the Upper and Lower parts of Michigan—is a marvel. So much so that I find it difficult, if not impossible, to appreciate the scale and grandeur of the bridge from just one vantage point. Driving on it, for example, offers a different experience than looking at it from nearby St. Ignace. And the view is awe inspiring from the water. We are looking at the same…
Gross Domestic Product by County and Metropolitan Area, 2022
In 2022, real gross domestic product increased in 1,780 counties, decreased in 1,296 counties, and was unchanged in 38 counties. The percent change in real GDP ranged from 71.1 percent in Chouteau County, MT, to –57.6 percent in Kiowa County, CO.


