Bureau of Economic Analysis
U.S. International Trade in Goods and Services, June 2025
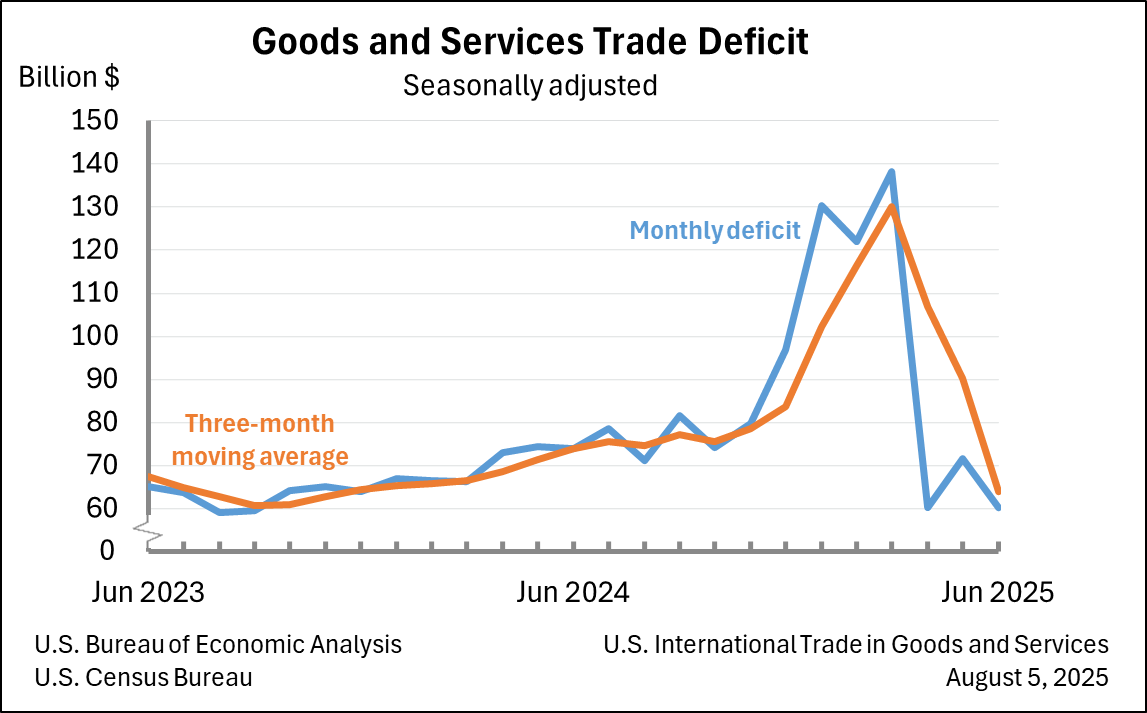
The U.S. goods and services trade deficit decreased in June 2025 according to the U.S. Bureau of Economic Analysis and the U.S. Census Bureau. The deficit decreased from $71.7 billion in May (revised) to $60.2 billion in June, as exports decreased less than imports. The goods deficit decreased $11.4 billion in June to $85.9 billion. The services surplus increased $0.1 billion in June to $25.7 billion.
Principal Federal Economic Indicators
Noteworthy
- 2025 News Release Schedule
- Innovation at BEA
- 2025 Annual Updates
- Distribution of Personal Income Nowcast
- New! Services Trade Data for More Countries
- Data Tool: Trade in Value Added
- Updated: RIMS II Regional Multipliers
- Arts and Culture
- Space Economy
- FDI Now in State BEARFACTS
- Quick Guide: Price Indexes
The Latest
Value of Foreign Investments in the United States Increased More Than Value of U.S. Investments Abroad in 2012
The U.S. net international investment position was -$3,863.9 billion (revised) at the end of 2012 compared with -$3,730.6 billion (revised) at the end of 2011, as the value of foreign investments in the United States exceeded the value of U.S. investments abroad.
Improved Source Data Leads to Upward Revisions to the U.S. International Investment Position
Better data generated by a new government survey drove the large upward revisions in U.S. international investment position statistics released today that trimmed the United States’ investment deficit with the rest of the world between 2010 and 2012.
The Treasury Department and the Federal Reserve Board conducted the new survey called Aggregate Holdings of Long-Term Securities by U.S. and Foreign Residents (SLT), which includes…
U.S. International Investment Position, 1st Quarter 2013, Year 2012, and Annual Revisions
Quarterly and Annual Statistics
In this release, BEA presents the U.S. international investment position statistics for the first quarter of 2013 along with historical revisions and detailed annual statistics for 2012, including changes in positions resulting from annual financial flows and valuation changes such as price, exchange-rate, and other changes. Quarterly positions are revised for the first quarter of 2009 to the fourth…
Travel and Tourism Spending Outpaced Growth in the Overall Economy in the First Quarter of 2013
Real spending on travel and tourism accelerated in the first quarter of 2013, increasing at an annual rate of 6.8 percent after increasing 2.1 percent (revised) in the fourth quarter of 2012. By comparison, growth in real gross domestic product (GDP) increased 2.4 percent (second estimate) in the first quarter after increasing 0.4 percent in the fourth quarter.
Travel and Tourism Satellite Accounts, 1st quarter 2013
Real spending on travel and tourism accelerated in the first quarter of 2013, increasing at an annual rate of 6.8 percent after increasing 2.1 percent (revised) in the fourth quarter of 2012. By comparison, growth in real gross domestic product (GDP) increased 2.4 percent (second estimate) in the first quarter after increasing 0.4 percent in the fourth quarter.
BEA's Industry Economic Accounts to Hit Major Milestone
Roughly every 5 years, the Bureau of Economic Analysis (BEA) releases comprehensive revisions of its major economic accounts. These revisions are generally more detailed than annual revisions, implementing changes in methods, statistics and definitions to better reflect an ever-evolving economy. In December, BEA will release the 2013 comprehensive revision of the Industry Economic Accounts (IEAs), which includes two main sets of statistics,…
BEA to Expand Coverage of Intellectual Property Rights
Expenditures for research and development (R&D) and for entertainment, literary, and artistic originals provide long-lasting service to the businesses, nonprofit institutions, and government agencies that use them. These expenditures have many characteristics of other fixed assets—ownership rights can be established, and they are long lasting and used repeatedly in production processes. As part of its 14th comprehensive revision of the…
BEA to Move to Accrual Accounting for Defined Benefit Pension Plans
Employers provide employees with retirement benefits largely through two mechanisms: defined contribution plans like 401(k)s or defined benefit pension plans. Under defined benefit plans, employees accrue benefits based on factors such as the employee’s length of service and salary history. Employers provide these promised benefits to employees through a pension fund. Employers, and in some cases employees, make cash contributions to the…
U.S. Current-Account Deficit Increases in First Quarter 2013
The U.S. current-account deficit—the combined balances on trade in goods and services, income, and net unilateral current transfers—increased to $106.1 billion (preliminary) in the first quarter of 2013 from $102.3 billion (revised) in the fourth quarter of 2012. As a percentage of U.S. gross domestic product, the deficit increased to 2.7 percent from 2.6 percent. The previously published current-account deficit for the fourth quarter was $…
U.S. International Transactions, 1st quarter 2013 and Annual Revisions
NOTE: See the navigation bar at the right side of the news release text for links to data tables, contact personnel and their telephone numbers, and supplementary materials.
Sarah Scott: (202) 606-9286 (Data) Paul W. Farello: (202) 606-9561 (…


