
Bureau of Economic Analysis
Personal Income and Outlays, June 2025
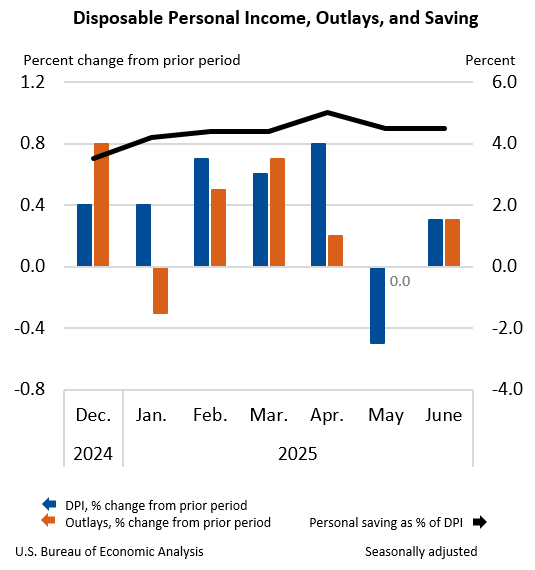
Personal income increased $71.4 billion (0.3 percent at a monthly rate) in June, according to estimates released today by the U.S. Bureau of Economic Analysis. Disposable personal income (DPI)—personal income less personal current taxes—increased $61.0 billion (0.3 percent) and personal consumption expenditures (PCE) increased $69.9 billion (0.3 percent). Personal outlays—the sum of PCE, personal interest payments, and personal current transfer payments—increased $69.5 billion in June. Personal saving was $1.01 trillion in June and the personal saving rate—personal saving as a percentage of disposable personal income—was 4.5 percent.
Principal Federal Economic Indicators
Noteworthy
- 2025 News Release Schedule
- Innovation at BEA
- 2025 Annual Updates
- New! Services Trade Data for More Countries
- Data Tool: Trade in Value Added
- Distribution of State Personal Income
- Updated: RIMS II Regional Multipliers
- Arts and Culture
- Space Economy
- FDI Now in State BEARFACTS
- Quick Guide: Price Indexes


The Latest
Personal Income Rose in Most Counties in 2011
Personal income rose in 3,062 of the nation’s 3,113 counties in 2011, with growth ranging from 62.2 percent in King County, TX, to –28.8 percent in Lynn County, TX. Of the 50 counties with the fastest personal income growth in 2011, 45 were located in the Plains Region—with 41 of the 45 counties located in Nebraska, North Dakota, and South Dakota. Increases in farm income were a major factor in the growth rates for most of these…
Personal Income Rose in All 366 Metro Areas in 2011
Personal income rose in 2011 in all of the nation’s 366 metropolitan statistical areas (MSAs) for the first time since 2007. Personal income growth ranged from 14.8 percent in Odessa, TX, to 1.0 percent in Rochester, MN. Personal income in the United States rose 5.2 percent in 2011, up from 3.8 percent in 2010. Inflation, as measured by the national price index for personal consumption expenditures, accelerated to 2.4 percent in 2011…
Local Area Personal Income, 2009-2011
Personal income rose in 2011 in all of the nations 366 metropolitan statistical areas (MSAs) for the first time since 2007, according to estimates released today by the U.S. Bureau of Economic Analysis. Personal income growth ranged from 14.8 percent in Odessa, Texas to 1.0 percent in Rochester, Minnesota. Personal income in the United States rose 5.2 percent in 2011, up from 3.8 percent in 2010. Inflation, as measured by the national price…
Growth in Goods and Services Industries Slowed in 2011
Retail trade and durable goods manufacturing were the leading contributors to the deceleration in U.S. economic growth in 2011, according to revised statistics on the breakout of real gross domestic product (GDP) by industry from the Bureau of Economic Analysis.
Revised Statistics of Gross Domestic Product by Industry, 2009-2011
Retail trade and durable goods manufacturing were the leading contributors to the deceleration in U.S. economic growth in 2011, according to revised statistics on the breakout of real gross domestic product (GDP) by industry from the Bureau of Economic Analysis. Real GDP growth slowed in 2011, increasing 1.8 percent after increasing 2.4 percent in 2010. The revised statistics do not change the general picture of the economy: 12 of 22…
The Use Table: An Essential Tool That Looks Deep Inside the U.S. Economy
What’s the foundation for many economic statistics both inside and outside the Bureau of Economic Analysis (BEA)? It’s something most people have never heard of, yet it is essential for finding out what’s going on inside the world’s largest economy. It’s called the “use table,” and it is a fundamental tool of BEA’s input-output accounts. The use table provides both a broad and a detailed look at the U.S. economy. It is simple, yet…
September 2012 Trade Gap is $41.5 Billion
The U.S. monthly international trade deficit decreased in September 2012, according to the U.S. Bureau of Economic Analysis and the U.S. Census Bureau. The deficit decreased from $43.8 billion (revised) in August to $41.5 billion in September, as exports increased more than imports. The previously published August deficit was $44.2 billion. The goods deficit decreased $1.4 billion from August to $57.5 billion in September, and the services…
New Guide Helps Regional Developers, Planners Navigate RIMS II
People who conduct or examine local or regional economic impact studies will want to read a new handbook that offers some dos and don’ts on using the Bureau of Economic Analysis (BEA) Regional Input-Output Modeling System (RIMS II).
RIMS II, a regional economic model, is most frequently used by investors, regional planners, and government officials to gauge the economy-wide impact of a change in economic activity on a local community…
Real Consumer Spending Picks Up in September
Personal income increased 0.4 percent in September after increasing 0.1 percent in August. Wages and salaries, the largest component of personal income, increased 0.3 percent in September after increasing 0.1 percent in August. Government social benefits to persons turned up in September.
Current-dollar disposable personal income (DPI), after-tax income, increased 0.4 percent in September after increasing 0.1 percent in August.…