Bureau of Economic Analysis
New Foreign Direct Investment in the United States, 2024
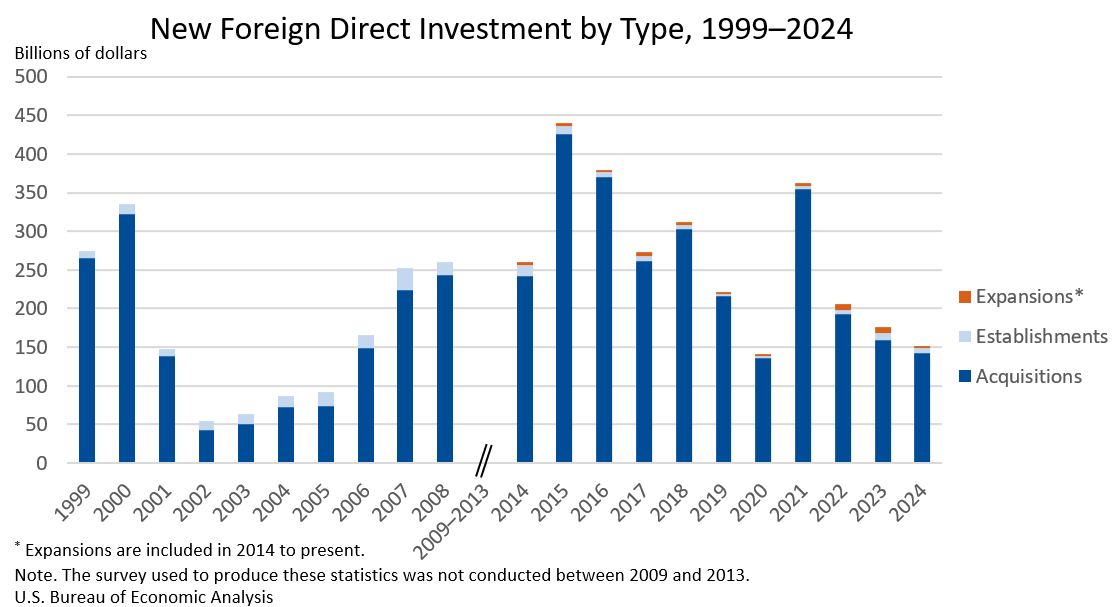
Expenditures by foreign direct investors to acquire, establish, or expand U.S. businesses totaled $151.0 billion in 2024, according to preliminary statistics released today by the U.S. Bureau of Economic Analysis. Expenditures decreased $24.9 billion, or 14.2 percent, from $176.0 billion (revised) in 2023 and were below the annual average of $277.2 billion for 2014–2023. As in previous years, acquisitions of existing U.S. businesses accounted for most of the expenditures.
Principal Federal Economic Indicators
Noteworthy
- 2025 News Release Schedule
- Innovation at BEA
- 2025 Annual Updates
- New! Services Trade Data for More Countries
- Data Tool: Trade in Value Added
- Distribution of State Personal Income
- Updated: RIMS II Regional Multipliers
- Arts and Culture
- Space Economy
- FDI Now in State BEARFACTS
- Quick Guide: Price Indexes
The Latest
Commonwealth of the Northern Mariana Islands (CNMI) Gross Domestic Product, 2010
This release is available as a PDF download.
BEA Wins Award for Interactive Data Tables
The Bureau of Economic Analysis (BEA) is being recognized for an innovation that makes our data easier for people to access.
The Center for Digital Government is presenting BEA with its 2012 Driving Digital Government Award at an event today in San Francisco. BEA was honored for its interactive data tables, which are available on BEA’s public Web site.
July 2012 Trade Gap is $42.0 Billion
The U.S. monthly international trade deficit increased in July 2012, according to the U.S. Bureau of Economic Analysis and the U.S. Census Bureau. The deficit increased from $41.9 billion (revised) in June to $42.0 billion in July, as exports decreased more than imports. The previously published June deficit was $42.9 billion. The goods deficit decreased $0.2 billion from June to $57.3 billion in July, and the services surplus decreased $0.3…
American Samoa GDP Grew in 2010
The economy of American Samoa grew 1.3 percent in 2010, according to new estimates from the Bureau of Economic Analysis (BEA). The growth in real gross domestic product (GDP) largely reflected increases in territorial government spending and private fixed investment, including construction.
For the first time, BEA also calculated estimates of GDP by industry, compensation by industry, and detailed consumer spending for the island…
American Samoa Gross Domestic Product, 2010
This release is available as a PDF download.
Trade in Digitally Enabled Services Shows Strong Growth
U.S. trade in services enabled by digital technologies grew at a faster pace than trade in all other services in recent years, a new analysis by the Bureau of Economic Analysis (BEA) shows. Information and communications technologies (ICT) play an important role in cross-border trade in services, and improvements in these digital technologies and reductions in their costs have played an important role in contributing to growth in trade in…
Learn More About the Ocean and Great Lakes Economy on BEA's New Web Portal
How many jobs are created from the construction of a new bridge or an increase in tourism?
The Bureau of Economic Analysis’ (BEA) new Web portal on the ocean and Great Lakes economy shows how the Bureau’s Regional Input-Output Modeling System (RIMS II) can be used to provide answers to such questions. The new Web site stems from a joint project with the Commerce Department’s National Oceanic and Atmospheric Administration.
Real Consumer Spending Picks Up in July
Personal income increased 0.3 percent in July, the same increase as in June. Wages and salaries, the largest component of personal income, increased 0.2 percent in July after increasing 0.4 percent in June.
Current-dollar disposable personal income (DPI), after-tax income, increased 0.3 percent in July, the same increase as in June.
Real DPI, income adjusted for taxes and inflation, increased 0.3 percent in July after…
Personal Income and Outlays, July 2012
Personal income increased $42.3 billion, or 0.3 percent, and disposable personal income (DPI) increased $39.9 billion, or 0.3 percent, in July, according to the Bureau of Economic Analysis. Personal consumption expenditures (PCE) increased $46.0 billion, or 0.4 percent. In June, personal income increased $46.1 billion, or 0.3 percent, DPI increased $37.4 billion, or 0.3 percent, and PCE increased $3.5 billion, or less than 0.1 percent, based…


