
Bureau of Economic Analysis
Personal Income and Outlays, June 2025
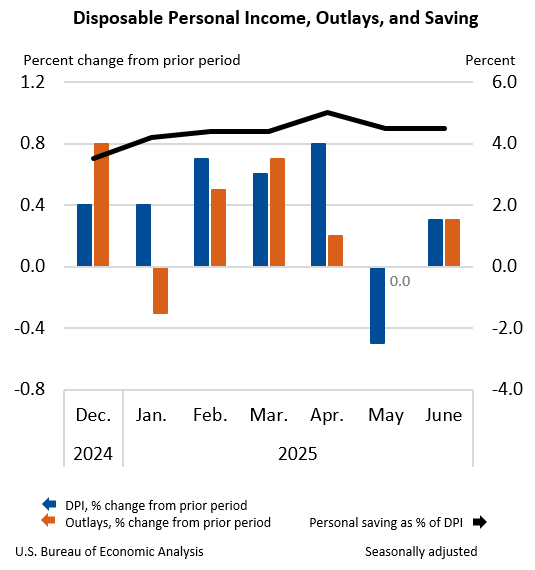
Personal income increased $71.4 billion (0.3 percent at a monthly rate) in June, according to estimates released today by the U.S. Bureau of Economic Analysis. Disposable personal income (DPI)—personal income less personal current taxes—increased $61.0 billion (0.3 percent) and personal consumption expenditures (PCE) increased $69.9 billion (0.3 percent). Personal outlays—the sum of PCE, personal interest payments, and personal current transfer payments—increased $69.5 billion in June. Personal saving was $1.01 trillion in June and the personal saving rate—personal saving as a percentage of disposable personal income—was 4.5 percent.
Principal Federal Economic Indicators
Noteworthy
- 2025 News Release Schedule
- Innovation at BEA
- 2025 Annual Updates
- New! Services Trade Data for More Countries
- Data Tool: Trade in Value Added
- Distribution of State Personal Income
- Updated: RIMS II Regional Multipliers
- Arts and Culture
- Space Economy
- FDI Now in State BEARFACTS
- Quick Guide: Price Indexes


The Latest
Real Disposable Personal Income Picks Up
Personal income increased 0.2 percent in May, the same increase as in April. The increase in wages and salaries was less than 0.1 percent in May, compared with an increase of 0.1 percent in April.
Current-dollar disposable personal income (DPI)—after-tax income—increased 0.2 percent in May, the same increase as in April.
Real DPI— income adjusted for taxes and inflation—increased 0.3 percent in May after increasing 0.1 percent…
Personal Income and Outlays, May 2012
Personal income increased $25.4 billion, or 0.2 percent, and disposable personal income (DPI) increased $18.5 billion, or 0.2 percent, in May, according to the Bureau of Economic Analysis. Personal consumption expenditures (PCE) decreased $4.7 billion, or less than 0.1 percent. In April, personal income increased $29.4 billion, or 0.2 percent, DPI increased $19.5 billion, or 0.2 percent, and PCE increased $16.2 billion, or 0.1 percent, based…
GDP Growth Slows in First Quarter
Real gross domestic product (GDP) rose 1.9 percent in the first quarter of 2012 after rising 3.0 percent in the fourth quarter, according to estimates released by the Bureau of Economic Analysis. The first-quarter growth rate was unchanged from the second estimate released in May.
Gross Domestic Product, 1st quarter 2012 (third estimate); Corporate Profits, 1st quarter 2012 (revised estimate)
Real gross domestic product -- the output of goods and services produced by labor and property located in the United States -- increased at an annual rate of 1.9 percent in the first quarter of 2012 (that is, from the fourth quarter to the first quarter), according to the "third" estimate released by the Bureau of Economic Analysis. In the fourth quarter, real GDP increased 3.0 percent. The GDP estimate released today is based on more…
Personal Income in States Grows
State personal income growth accelerated to 0.8 percent in the first quarter of 2012, from 0.4 percent in the fourth quarter of 2011. Personal income rose in 47 of the 50 states, fell in Kansas and Mississippi, and was unchanged in Oklahoma. The percent change across states ranged from 2.3 percent in North Dakota to –0.3 percent in Mississippi. Inflation, as measured by the national price index for personal consumption expenditures, increased…
State Quarterly Personal Income, 1st quarter 2011-1st quarter 2012
WASHINGTON DC, June 27, 2012 - State personal income growth accelerated to 0.8 percent in the first quarter of 2012, from 0.4 percent in the fourth quarter of 2011, according to estimates released today by the U.S. Bureau of Economic Analysis. Personal income rose in 47 of the 50 states, fell in Kansas and Mississippi, and was unchanged in Oklahoma. The percent change across states ranged from 2.3 percent in North Dakota to –0.3 percent in…
Value of Foreign Investment in the U.S. Increased More than Value of U.S. Investment Abroad in 2011
The U.S. net international investment position at yearend 2011 was –$4,030.3 billion (preliminary), as the value of foreign investment in the United States exceeded the value of U.S. investment abroad. At yearend 2010, the U.S. net international investment position was –$2,473.6 billion (revised).
Increases in the prices of U.S. Treasury bonds and declines in foreign stock prices raised the value of foreign investment in the…
U.S. International Investment Position, 2011
The U.S. net international investment position at yearend 2011 was -$4,030.3 billion (preliminary), as the value of foreign investment in the United States continued to exceed the value of U.S. investment abroad (table 1). At yearend 2010, the U.S. net international investment position was -$2,473.6 billion (revised). The -$1,556.7 billion change in the U.S.
New Global Guidelines Offer 'How To' for More Consistent and Reliable Data
Globalization, the financial crisis, the Great Recession, and Europe’s fiscal problems underscore just how important it is for countries to produce timely, accurate, and consistent data. Information on real gross domestic product, inflation, balance sheets, and international trade are essential to assessing cross-country effects and coordinating effective monetary, fiscal, regulatory, and trade policies.
New Study Provides Profile of U.S. Firms that Export and Import Services
Data from the Bureau of Economic Analysis (BEA) show that the United States has historically maintained a trade surplus in private services. So what types of firms are involved in this kind of trade abroad? Thanks to a new BEA study we have a better understanding of the kinds of American companies that export and import services.
Here are some of the key findings: