Bureau of Economic Analysis
U.S. International Trade in Goods and Services, June 2025
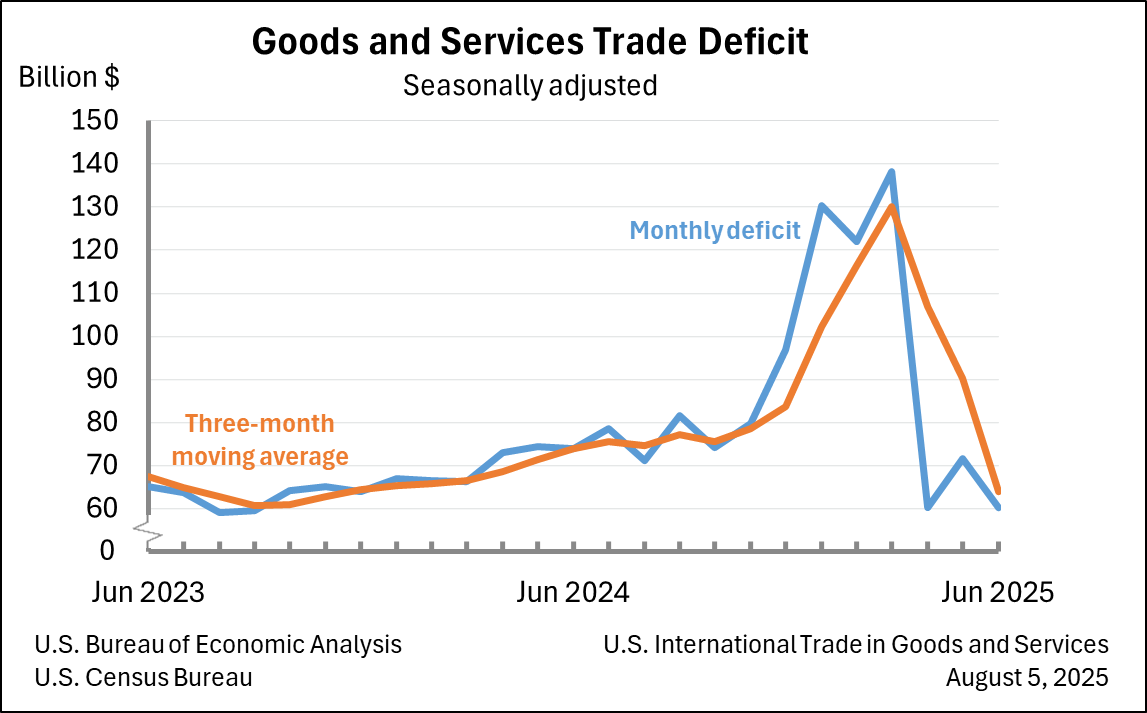
The U.S. goods and services trade deficit decreased in June 2025 according to the U.S. Bureau of Economic Analysis and the U.S. Census Bureau. The deficit decreased from $71.7 billion in May (revised) to $60.2 billion in June, as exports decreased less than imports. The goods deficit decreased $11.4 billion in June to $85.9 billion. The services surplus increased $0.1 billion in June to $25.7 billion.
Principal Federal Economic Indicators
Noteworthy
- 2025 News Release Schedule
- Innovation at BEA
- 2025 Annual Updates
- Distribution of Personal Income Nowcast
- New! Services Trade Data for More Countries
- Data Tool: Trade in Value Added
- Updated: RIMS II Regional Multipliers
- Arts and Culture
- Space Economy
- FDI Now in State BEARFACTS
- Quick Guide: Price Indexes
The Latest
Real Consumer Spending Picks Up in April
Personal income increased 0.2 percent in April after increasing 0.4 percent in March.
Current-dollar disposable personal income (DPI)—after-tax income—increased 0.2 percent in April after increasing 0.4 percent in March.
Real DPI—income adjusted for taxes and inflation—increased 0.2 percent in April, the same increase as in March.
Real consumer spending—spending adjusted for price changes—rose 0.3 percent in April…
Personal Income and Outlays, April 2012
Personal income increased $31.7 billion, or 0.2 percent, and disposable personal income (DPI) increased $22.0 billion, or 0.2 percent, inApril, according to the Bureau of Economic Analysis. Personal consumption expenditures (PCE) increased $31.8 billion, or 0.3 percent. In March, personal income increased $52.2 billion, or 0.4 percent, DPI increased $45.9 billion, or 0.4 percent, and PCE increased $25.4 billion, or 0.2 percent, based on…
GDP Growth Moderates in First Quarter
Real gross domestic product (GDP) rose 1.9 percent in the first quarter of 2012 after rising 3.0 percent in the fourth quarter, according to the second estimate released today by the Bureau of Economic Analysis. The first-quarter growth rate was 0.3 percentage point less than the “advance” estimate released in April.
Over the past 4 quarters, real GDP grew 2.0 percent.
First-quarter highlights An acceleration in consumer…
Gross Domestic Product, 1st quarter 2012 (second estimate); Corporate Profits, 1st quarter 2012 (preliminary estimate)
Real gross domestic product -- the output of goods and services produced by labor and property located in the United States -- increased at an annual rate of 1.9 percent in the first quarter of 2012 (that is, from the fourth quarter to the first quarter), according to the "second" estimate released by the Bureau of Economic Analysis. In the fourth quarter of 2011, real GDP increased 3.0 percent. The GDP estimate released today is based on…
What is the U.S. Bureau of Economic Analysis?
The U.S. Bureau of Economic Analysis, a unit of the U.S. Department of Commerce, is the federal agency responsible for measuring the U.S. economy, or as some say, BEA is the nation’s accountant.
Tracking Foreigners' Spending in the United States
Have you ever wondered what foreigners spend their money on while visiting the United States or what Americans buy while overseas? BEA is often asked for this information, but until recently, didn’t have the means to fully respond. So, we embarked on a research project aimed at finding the answers.
Personal Income Increased 0.4 Percent in March
Personal income in the United States increased 0.4 percent in March after increasing 0.3 percent in February. Wages and salaries rose 0.3 percent in March after rising 0.4 percent in February.
Current-dollar disposable personal income (DPI)—income after taxes—increased 0.4 percent in March after increasing 0.2 percent in February.
Real DPI—income adjusted for taxes and inflation—increased 0.2 percent in March after decreasing…
Personal Income and Outlays, March 2012
Personal income increased $50.3 billion, or 0.4 percent, and disposable personal income (DPI) increased $42.5 billion, or 0.4 percent, in March, according to the Bureau of Economic Analysis. Personal consumption expenditures (PCE) increased $29.6 billion, or 0.3 percent. In February, personal income increased $39.6 billion, or 0.3 percent, DPI increased $29.4 billion, or 0.2 percent, and PCE increased $93.7 billion, or 0.9 percent, based on…
GDP Growth Slows in First Quarter
Real gross domestic product (GDP) increased 2.2 percent in the first quarter of 2012 after increasing 3.0 percent in the fourth quarter of 2011, according to estimates released today by the U.S. Bureau of Economic Analysis.
First-quarter highlights The slower economic growth reflected slower growth in inventory and fixed investment by businesses:


