
Bureau of Economic Analysis
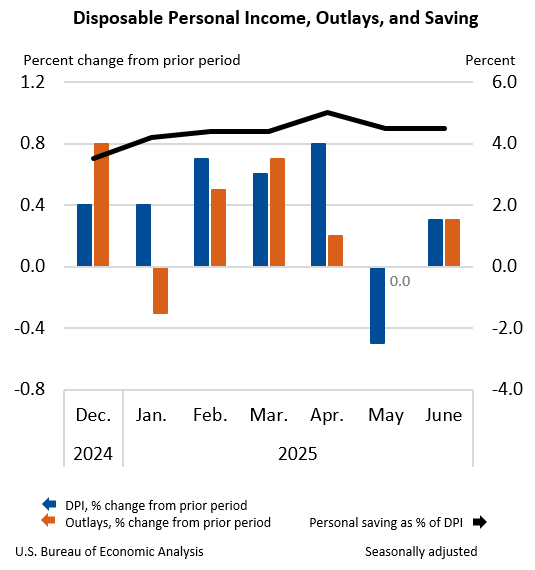
Personal Income and Outlays, June 2025
Personal income increased $71.4 billion (0.3 percent at a monthly rate) in June, according to estimates released today by the U.S. Bureau of Economic Analysis. Disposable personal income (DPI)—personal income less personal current taxes—increased $61.0 billion (0.3 percent) and personal consumption expenditures (PCE) increased $69.9 billion (0.3 percent). Personal outlays—the sum of PCE, personal interest payments, and personal current transfer payments—increased $69.5 billion in June. Personal saving was $1.01 trillion in June and the personal saving rate—personal saving as a percentage of disposable personal income—was 4.5 percent.
Principal Federal Economic Indicators
Noteworthy
- 2025 News Release Schedule
- Innovation at BEA
- 2025 Annual Updates
- New! Services Trade Data for More Countries
- Data Tool: Trade in Value Added
- Distribution of State Personal Income
- Updated: RIMS II Regional Multipliers
- Arts and Culture
- Space Economy
- FDI Now in State BEARFACTS
- Quick Guide: Price Indexes


The Latest
State Quarterly Personal Income, 1st quarter 2008-2nd quarter 2011; State Annual Personal Income, 2008-2010 (revised estimate)
WASHINGTON DC, September 22, 2011 – State personal income growth slowed to 1.1 percent, on average, in the second quarter of 2011, down from 2.1 percent in the first quarter, according to estimates released today by the U.S. Bureau of Economic Analysis. Growth rates ranged from 2.2 percent in Nebraska and South Dakota to 0.7 percent in the states of Washington and Georgia. Inflation, as measured by the national price index for personal…
Travel and Tourism Satellite Accounts, 2nd quarter 2011
Real spending on travel and tourism increased at an annual rate of 2.6 percent in the second quarter of 2011 after increasing 2.8 percent (revised) in the first quarter. Growth in travel and tourism outpaced growth in real gross domestic product (GDP), which increased 1.0 percent in the second quarter after increasing 0.4 percent in the first quarter. The growth in real spending on tourism primarily reflected increases in total…
U.S. International Transactions: Second Quarter 2011
Current Account The U.S. current-account deficit—the combined balances on trade in goods and services, income, and net unilateral current transfers—decreased to $118.0 billion (preliminary) in the second quarter of 2011, from $119.6 billion (revised) in the first quarter. The decrease was more than accounted for by increases in the surplus on income and the surplus on services.
Gross Domestic Product by Metropolitan Area, 2010 and Revised 2007-2009
ECONOMIC GROWTH WIDESPREAD ACROSS METROPOLITAN AREAS IN 2010
Advance 2010, and Revised 20072009 GDP-by-Metropolitan-Area Statistics
U.S. International Trade in Goods and Services, July 2011
U.S. Census Bureau U.S. Bureau of Economic Analysis NEWS U.S. Department of Commerce * Washington, DC 20230 U.S. INTERNATIONAL TRADE IN GOODS AND SERVICES July 2011 Goods and Services The U.S. Census Bureau and the U.S.
Personal Income and Outlays, July 2011
Personal income increased $42.4 billion, or 0.3 percent, and disposable personal income (DPI) increased $32.5 billion, or 0.3 percent, inJuly, according to the Bureau of Economic Analysis. Personal consumption expenditures (PCE) increased $88.4 billion, or 0.8 percent.
Gross Domestic Product, 2nd quarter 2011 (second estimate); Corporate Profits, 2nd quarter 2011 (preliminary estimate)
Real gross domestic product -- the output of goods and services produced by labor and property located in the United States -- increased at an annual rate of 1.0 percent in the second quarter of 2011, (that is, from the first quarter to the second quarter), according to the "second" estimate released by the Bureau of Economic Analysis. In the first quarter, real GDP increased 0.4 percent. The GDP estimates released today are based on…
U.S. International Trade in Goods and Services, June 2011
U.S. Census Bureau U.S. Bureau of Economic Analysis NEWS U.S. Department of Commerce * Washington, DC 20230 U.S. INTERNATIONAL TRADE IN GOODS AND SERVICES June 2011 Goods and Services The U.S. Census Bureau and the U.S.
Personal Income for Metropolitan Areas, 2010
WASHINGTON DC, August 9, 2011 – Personal income rose in 2010 in all but four of the nations 366 metropolitan statistical areas (MSAs), according to estimates released today by the U.S. Bureau of Economic Analysis. Personal income in the metropolitan portion of the United States rose 2.9 percent in 2010 after falling 1.9 percent in 2009. Personal income growth in 2010 ranged from 10.1 percent in Elizabethtown, Kentucky to -0.9 percent in…
Personal Income and Outlays, June 2011
Personal income increased $18.7 billion, or 0.1 percent, and disposable personal income (DPI) increased $16.3 billion, or 0.1 percent, inJune, according to the Bureau of Economic Analysis. Personal consumption expenditures (PCE) decreased $21.9 billion, or 0.2 percent. In May, personal income increased $23.2 billion, or 0.2 percent, DPI increased $17.6 billion, or 0.2 percent, and PCE increased $5.9 billion, or 0.1 percent, based on revised…