
Bureau of Economic Analysis
Personal Income and Outlays, June 2025
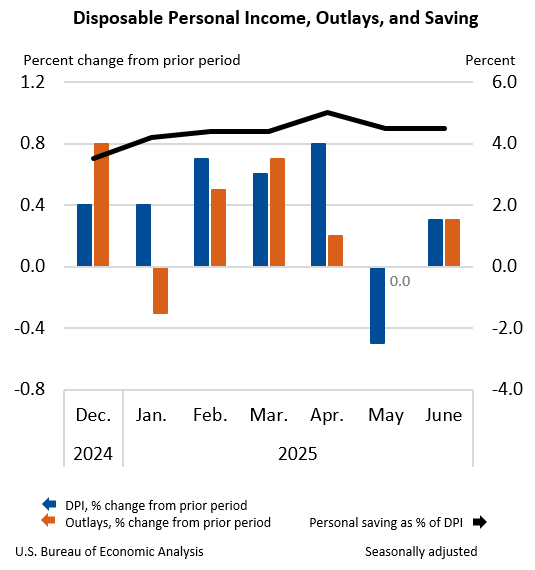
Personal income increased $71.4 billion (0.3 percent at a monthly rate) in June, according to estimates released today by the U.S. Bureau of Economic Analysis. Disposable personal income (DPI)—personal income less personal current taxes—increased $61.0 billion (0.3 percent) and personal consumption expenditures (PCE) increased $69.9 billion (0.3 percent). Personal outlays—the sum of PCE, personal interest payments, and personal current transfer payments—increased $69.5 billion in June. Personal saving was $1.01 trillion in June and the personal saving rate—personal saving as a percentage of disposable personal income—was 4.5 percent.
Principal Federal Economic Indicators
Noteworthy
- 2025 News Release Schedule
- Innovation at BEA
- 2025 Annual Updates
- New! Services Trade Data for More Countries
- Data Tool: Trade in Value Added
- Distribution of State Personal Income
- Updated: RIMS II Regional Multipliers
- Arts and Culture
- Space Economy
- FDI Now in State BEARFACTS
- Quick Guide: Price Indexes


The Latest
Gross Domestic Product, 2nd Quarter 2011 (advance estimate)
Real gross domestic product -- the output of goods and services produced by labor and property located in the United States -- increased at an annual rate of 1.3 percent in the second quarter of 2011, (that is, from the first quarter to the second quarter), according to the "advance" estimate released by the Bureau of Economic Analysis.
Gross Domestic Product for Guam, 2008-2009
This release is available as a PDF download.
Gross Domestic Product for the Commonwealth of the Northern Mariana Islands
This release is available as a PDF download.
U.S. International Trade in Goods and Services, May 2011
U.S. Census Bureau U.S. Bureau of Economic Analysis NEWS U.S. Department of Commerce * Washington, DC 20230 U.S. INTERNATIONAL TRADE IN GOODS AND SERVICES MAY 2011 Goods and Services The U.S. Census Bureau and the U.S.
U.S. International Investment Position, 2010
The U.S. net international investment position at yearend 2010 was -$2,471.0 billion (preliminary), as the value of foreign investments in the United States continued to exceed the value of U.S. investments abroad (table 1). At yearend 2009, the U.S. net international investment position was -$2,396.4 billion (revised). The -$74.6 billion change in the U.S. net investment position from yearend 2009 to yearend 2010…
Personal Income and Outlays, May 2011
Personal income increased $36.2 billion, or 0.3 percent, and disposable personal income (DPI) increased $29.2 billion, or 0.2 percent, inMay, according to the Bureau of Economic Analysis. Personal consumption expenditures (PCE) increased $4.6 billion, or less than 0.1 percent. In April, personal income increased $37.7 billion, or 0.3 percent, DPI increased $27.9 billion, or 0.2 percent, and PCE increased $28.8 billion, or 0.3 percent, based on…
Gross Domestic Product, 1st quarter 2011 (third estimate)
Real gross domestic product -- the output of goods and services produced by labor and property located in the United States -- increased at an annual rate of 1.9 percent in the first quarter of 2011, (that is, from the fourth quarter to the first quarter), according to the "third" estimate released by the Bureau of Economic Analysis. In the fourth quarter, real GDP increased 3.1 percent. The GDP estimate released today is based on more…
State Personal Income: First Quarter 2011
WASHINGTON DC, June 22, 2011 – State personal income growth accelerated to 1.8 percent in the first quarter of 2011, from 0.8 percent in the fourth quarter of 2010, according to estimates released today by the U.S. Bureau of Economic Analysis. Personal income increased in all states, with growth ranging from 0.7 percent in Iowa to 6.9 percent in North Dakota. Inflation, as measured by the national price index for personal consumption…
State Quarterly Personal Income, 1st quarter 2010-1st quarter 2011
Real spending on travel and tourism increased at an annual rate of 0.6 percent in the first quarter of 2011, following an increase of 2.6 percent (revised) in the fourth quarter of 2010. By comparison, real gross domestic product (GDP) increased 1.8 percent in the first quarter, after increasing 3.1 percent in the fourth quarter. The slowdown in real spending on tourism reflected a downturn in both domestic and international passenger air…
U.S. International Transactions: First Quarter 2011
U.S. International Transactions: First Quarter 2011 Current Account The U.S. current-account deficit—the combined balances on trade in goods and services, income, and net unilateral current transfers—increased to $119.3 billion (preliminary) in the first quarter of 2011, from $112.2 billion (revised) in the fourth quarter of 2010. The increase was more than accounted for by an increase…