
Bureau of Economic Analysis
U.S. International Trade in Goods and Services, September 2025
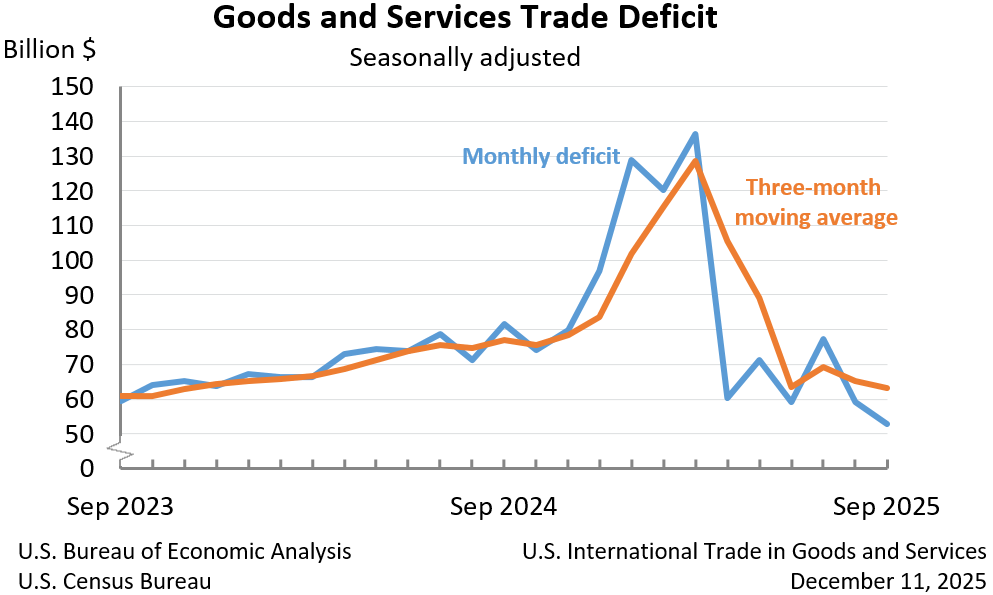
The U.S. goods and services trade deficit decreased in September 2025 according to the U.S. Bureau of Economic Analysis and the U.S. Census Bureau. The deficit decreased from $59.3 billion in August (revised) to $52.8 billion in September, as exports increased more than imports. The goods deficit decreased $7.1 billion in September to $79.0 billion. The services surplus decreased $0.6 billion in September to $26.2 billion.
Principal Federal Economic Indicators
Noteworthy


The Latest
U.S. International Investment Position, 2009
The U.S. net international investment position at yearend 2009 was -$2,737.8 billion (preliminary), as the value of foreign investments in the United States continued to exceed the value of U.S. investments abroad (table 1). At yearend 2008, the U.S. net international investment position was -$3,493.9 billion (revised). The $756.0 billion change in the U.S. net investment position from yearend 2008 to yearend 2009…
Travel and Tourism Satellite Accounts, 1st quarter 2010
QUARTERLY TOURISM ESTIMATES WILL NOT BE DISCONTINUED (SEE THE BOX NEXT RELEASE)
-->
-->
Real spending on travel and tourism increased at an annual rate of 3.9 percent in 2010:1, following a decrease of 1.5 percent (revised) in 2009:4. By comparison, real gross domestic product (GDP) increased 3.0 percent (second estimate) in 2010:1 after increasing 5.6 percent in 2009:4. Travel and tourism prices…
State Quarterly Personal Income, 1st quarter 2009-1st quarter 2010
WASHINGTON DC, June 18, 2010 – State personal income growth averaged 0.9 percent in the first quarter of 2010 up from 0.5 percent in the fourth quarter of 2009, according to estimates released today by the U.S. Bureau of Economic Analysis. Personal income increased in all but two states with growth ranging from 1.6 percent in Mississippi to –2.0 percent in North Dakota. Inflation, as measured by the national price index for personal…
U.S. International Transactions, 1st quarter 2010
NOTE: See the navigation bar at the right side of the news release text for links to data tables, contact personnel and their telephone numbers, and supplementary materials.
Daniel R. Yorgason: (202) 606-9804 (Data) Paul W. Farello: (202) 606-9561 (Revisions)
Gross Domestic Product for Guam, 2002-2007
HAGATNA, GUAM (June 14, 2010) – Today, the Bureau of Economic Analysis (BEA) is releasing its first set of estimates of the major components of gross domestic product (GDP) for Guam.1
U.S. International Trade in Goods and Services, 2009 annual revision
U.S. Census Bureau U.S. Bureau of Economic Analysis NEWS
Gross Domestic Product for the Commonwealth of the Northern Mariana Islands
CAPITAL HILL, SAIPAN (June 7, 2010) – Today, the Bureau of Economic Analysis (BEA) is releasing its first set of estimates of the major components of gross domestic product (GDP) for the Commonwealth of the Northern Mariana Islands (CNMI).1
Personal Income and Outlays, April 2010
Personal income increased $54.4 billion, or 0.4 percent, and disposable personal income (DPI) increased $57.6 billion, or 0.5 percent, inApril, according to the Bureau of Economic Analysis. Personal consumption expenditures (PCE) increased $4.0 billion, or less than 0.1 percent.
Gross Domestic Product, 1st quarter 2010 (second estimate) | Corporate Profits, 1st quarter 2010 (preliminary estimate)
Real gross domestic product -- the output of goods and services produced by labor and property located in the United States -- increased at an annual rate of 3.0 percent in the first quarter of 2010, (that is, from the fourth quarter to the first quarter), according to the "second" estimate released by the Bureau of Economic Analysis. In the fourth quarter, real GDP had increased 5.6 percent. The GDP estimates released today are based on…