Bureau of Economic Analysis
New Foreign Direct Investment in the United States, 2024
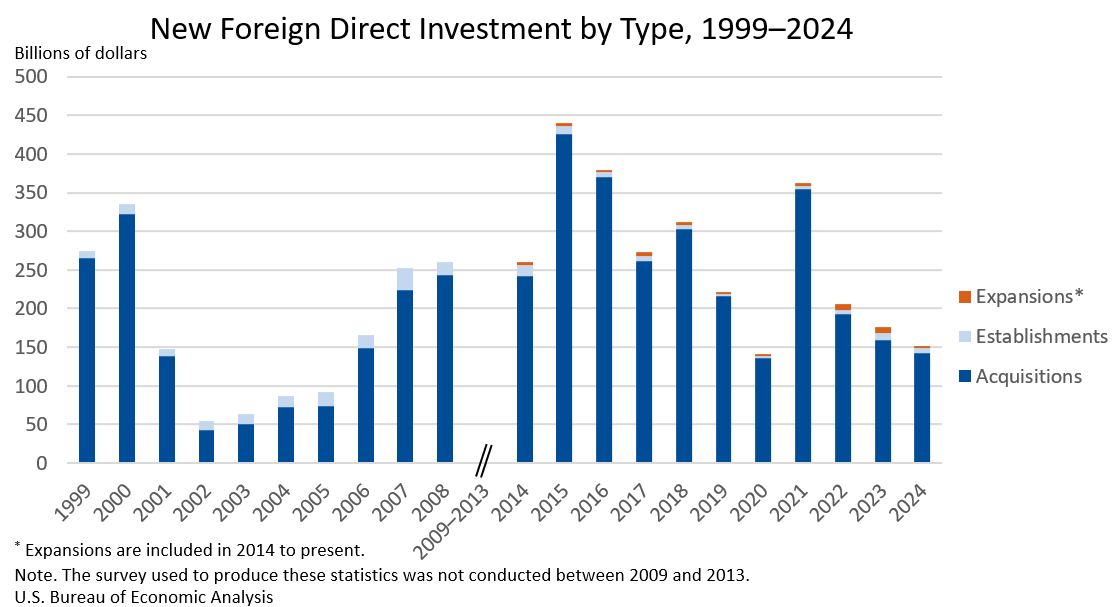
Expenditures by foreign direct investors to acquire, establish, or expand U.S. businesses totaled $151.0 billion in 2024, according to preliminary statistics released today by the U.S. Bureau of Economic Analysis. Expenditures decreased $24.9 billion, or 14.2 percent, from $176.0 billion (revised) in 2023 and were below the annual average of $277.2 billion for 2014–2023. As in previous years, acquisitions of existing U.S. businesses accounted for most of the expenditures.
Principal Federal Economic Indicators
Noteworthy
- 2025 News Release Schedule
- Innovation at BEA
- 2025 Annual Updates
- New! Services Trade Data for More Countries
- Data Tool: Trade in Value Added
- Distribution of State Personal Income
- Updated: RIMS II Regional Multipliers
- Arts and Culture
- Space Economy
- FDI Now in State BEARFACTS
- Quick Guide: Price Indexes
The Latest
Gross Domestic Product by State, advance 2007 and revised 2004-2006
EMBARGOED UNTIL RELEASE AT 8:30 A.M. EDT, Thursday, June 5, 2008
Foreign Investors' Spending, 2007
Outlays by foreign direct investors to acquire or to establish U.S. businesses increased sharply in 2007 after also increasing strongly in 2006. Outlays reached $276.8 billion in 2007, the second largest recorded and the highest since 2000, when new investment outlays peaked at $335.6 billion.
Personal Income and Outlays, April 2008
April 2008 Personal income increased $20.1 billion, or 0.2 percent, and disposable personal income (DPI) increased $23.4 billion, or 0.2 percent, in April, according to the Bureau of Economic Analysis. Personal consumption expenditures (PCE) increased $21.4 billion, or 0.2 percent.
Gross Domestic Product and Corporate Profits, First Quarter 2008 (preliminary)
Real gross domestic product -- the output of goods and services produced by labor and property located in the United States -- increased at an annual rate of 0.9 percent in the first quarter of 2008, according to preliminary estimates released by the Bureau of Economic Analysis. In the fourth quarter, real GDP increased 0.6 percent. The GDP estimates released today are based on more complete source data than were available for the advance…
U.S. International Trade in Goods and Services: March 2008
MARCH 2008 Goods and Services The U.S. Census Bureau and the U.S. Bureau of Economic Analysis, through the Department of Commerce, announced today that total March exports of $148.5 billion and imports of $206.7 billion resulted in a goods and services deficit of $58.2 billion, down from $61.7 billion in February, revised. March exports were $2.6 billion less than February exports of $151.1 billion.
Personal Income and Outlays, March 2008
March 2008 Personal income increased $38.8 billion, or 0.3 percent, and disposable personal income (DPI) increased $29.6 billion, or 0.3 percent, in March, according to the Bureau of Economic Analysis. Personal consumption expenditures (PCE) increased $42.9 billion, or 0.4 percent.
Gross Domestic Product, First Quarter 2008 (advance)
Real gross domestic product -- the output of goods and services produced by labor and property located in the United States -- increased at an annual rate of 0.6 percent in the first quarter of 2008, according to advance estimates released by the Bureau of Economic Analysis. In the fourth quarter, real GDP also increased 0.6 percent. The Bureau emphasized that the first-quarter "advance" estimates are based on source data that are…
Gross Domestic Product by Industry (advance)
This release is available as a PDF download.
Local Area Personal Income, 2006
WASHINGTON DC, April 24, 2008 – Today, the Bureau of Economic Analysis (BEA) released estimates of personal income at the county level for 2006 based on newly available source data. Personal income is a comprehensive measure of the income of all persons from all sources. In addition to wages and salaries it includes employer–provided health insurance, dividends and interest income, social security benefits, and other types of income.1
Summary Estimates for Multinational Companies: Employment, Sales, and Capital Expenditures for 2006
NOTE: See the navigation bar at the right side of the news release text for links to data tables, contact personnel and their telephone numbers, and supplementary materials.
Summary Estimates for Multinational Companies: Employment, Sales, and Capital Expenditures for 2006--> -->


