
Bureau of Economic Analysis
U.S. International Transactions and Investment Position, 4th Quarter and Year 2025
U.S. International Transactions
| Current-Account Balance | |
|---|---|
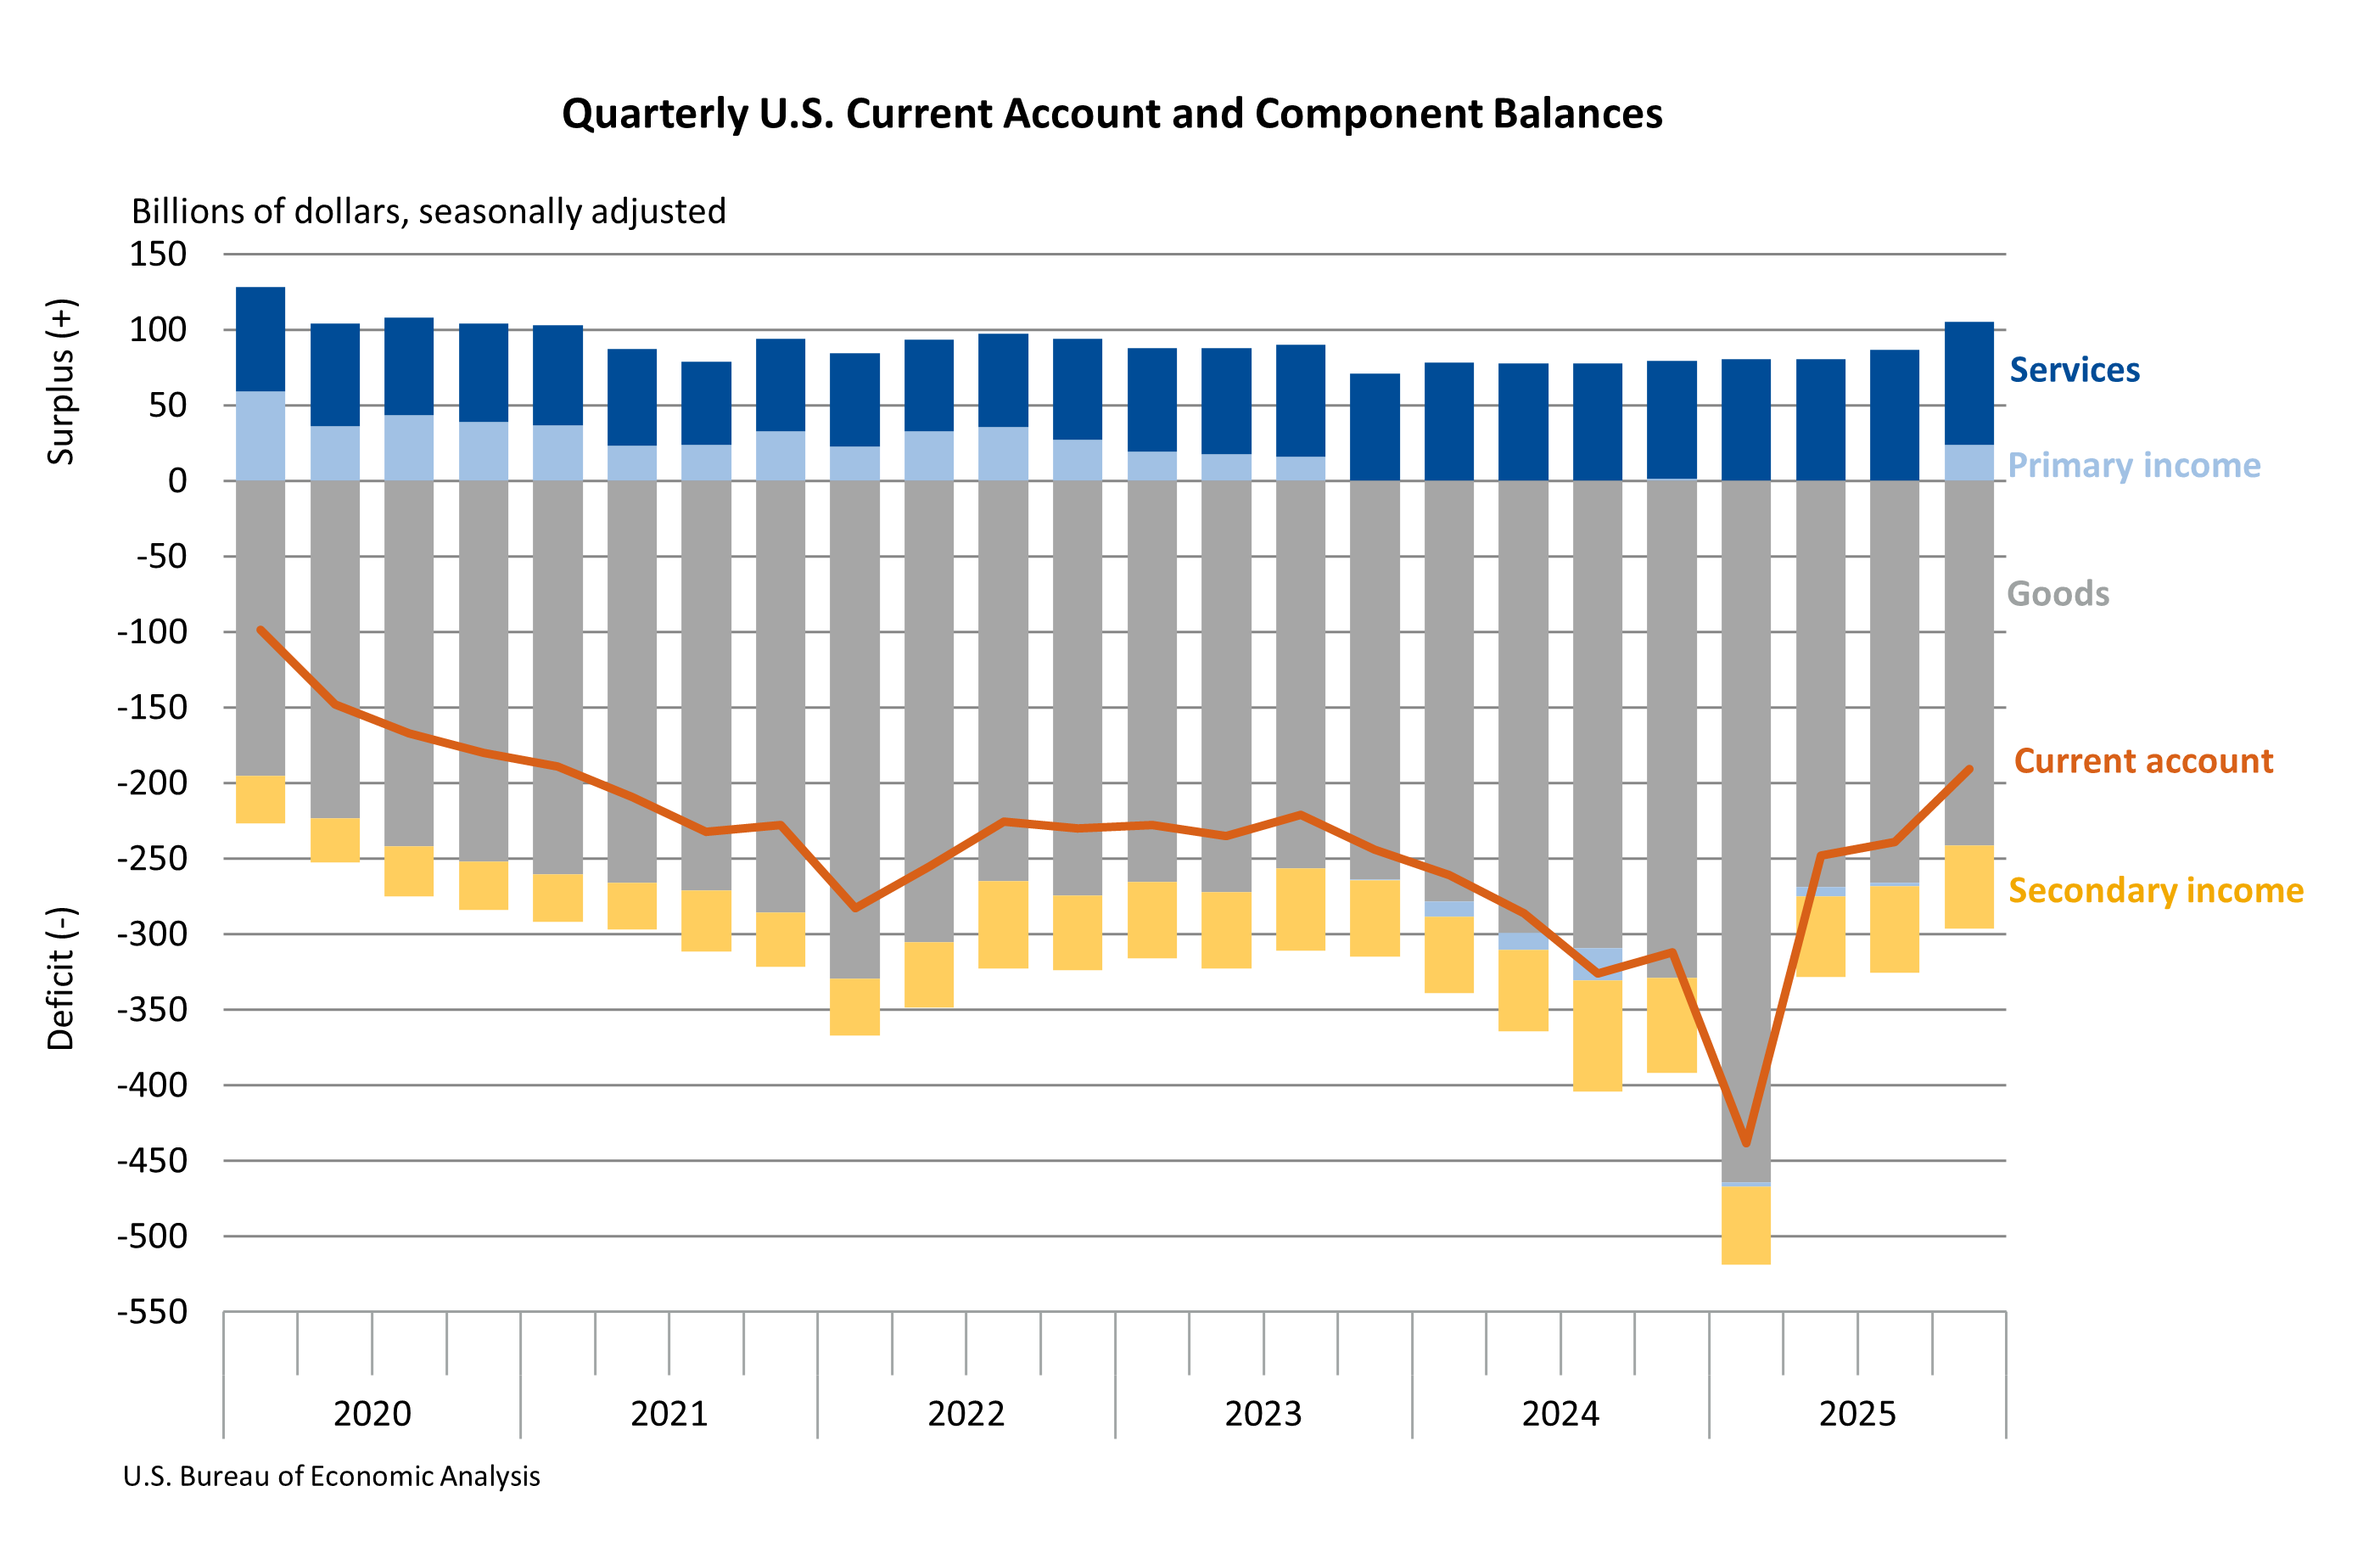
Q4 2025 | -$190.7 B |
Q3 2025 | -$239.1 B |
The U.S. current-account deficit resulting from international economic transactions narrowed by $48.4 billion, or 20.2 percent, to $190.7 billion in the fourth quarter of 2025, according to statistics released today by the U.S. Bureau of Economic Analysis. The revised third-quarter deficit was $239.1 billion. The fourth-quarter deficit was 2.4 percent of current-dollar gross domestic product, down from 3.1 percent in the third quarter.
U.S. International Investment Position
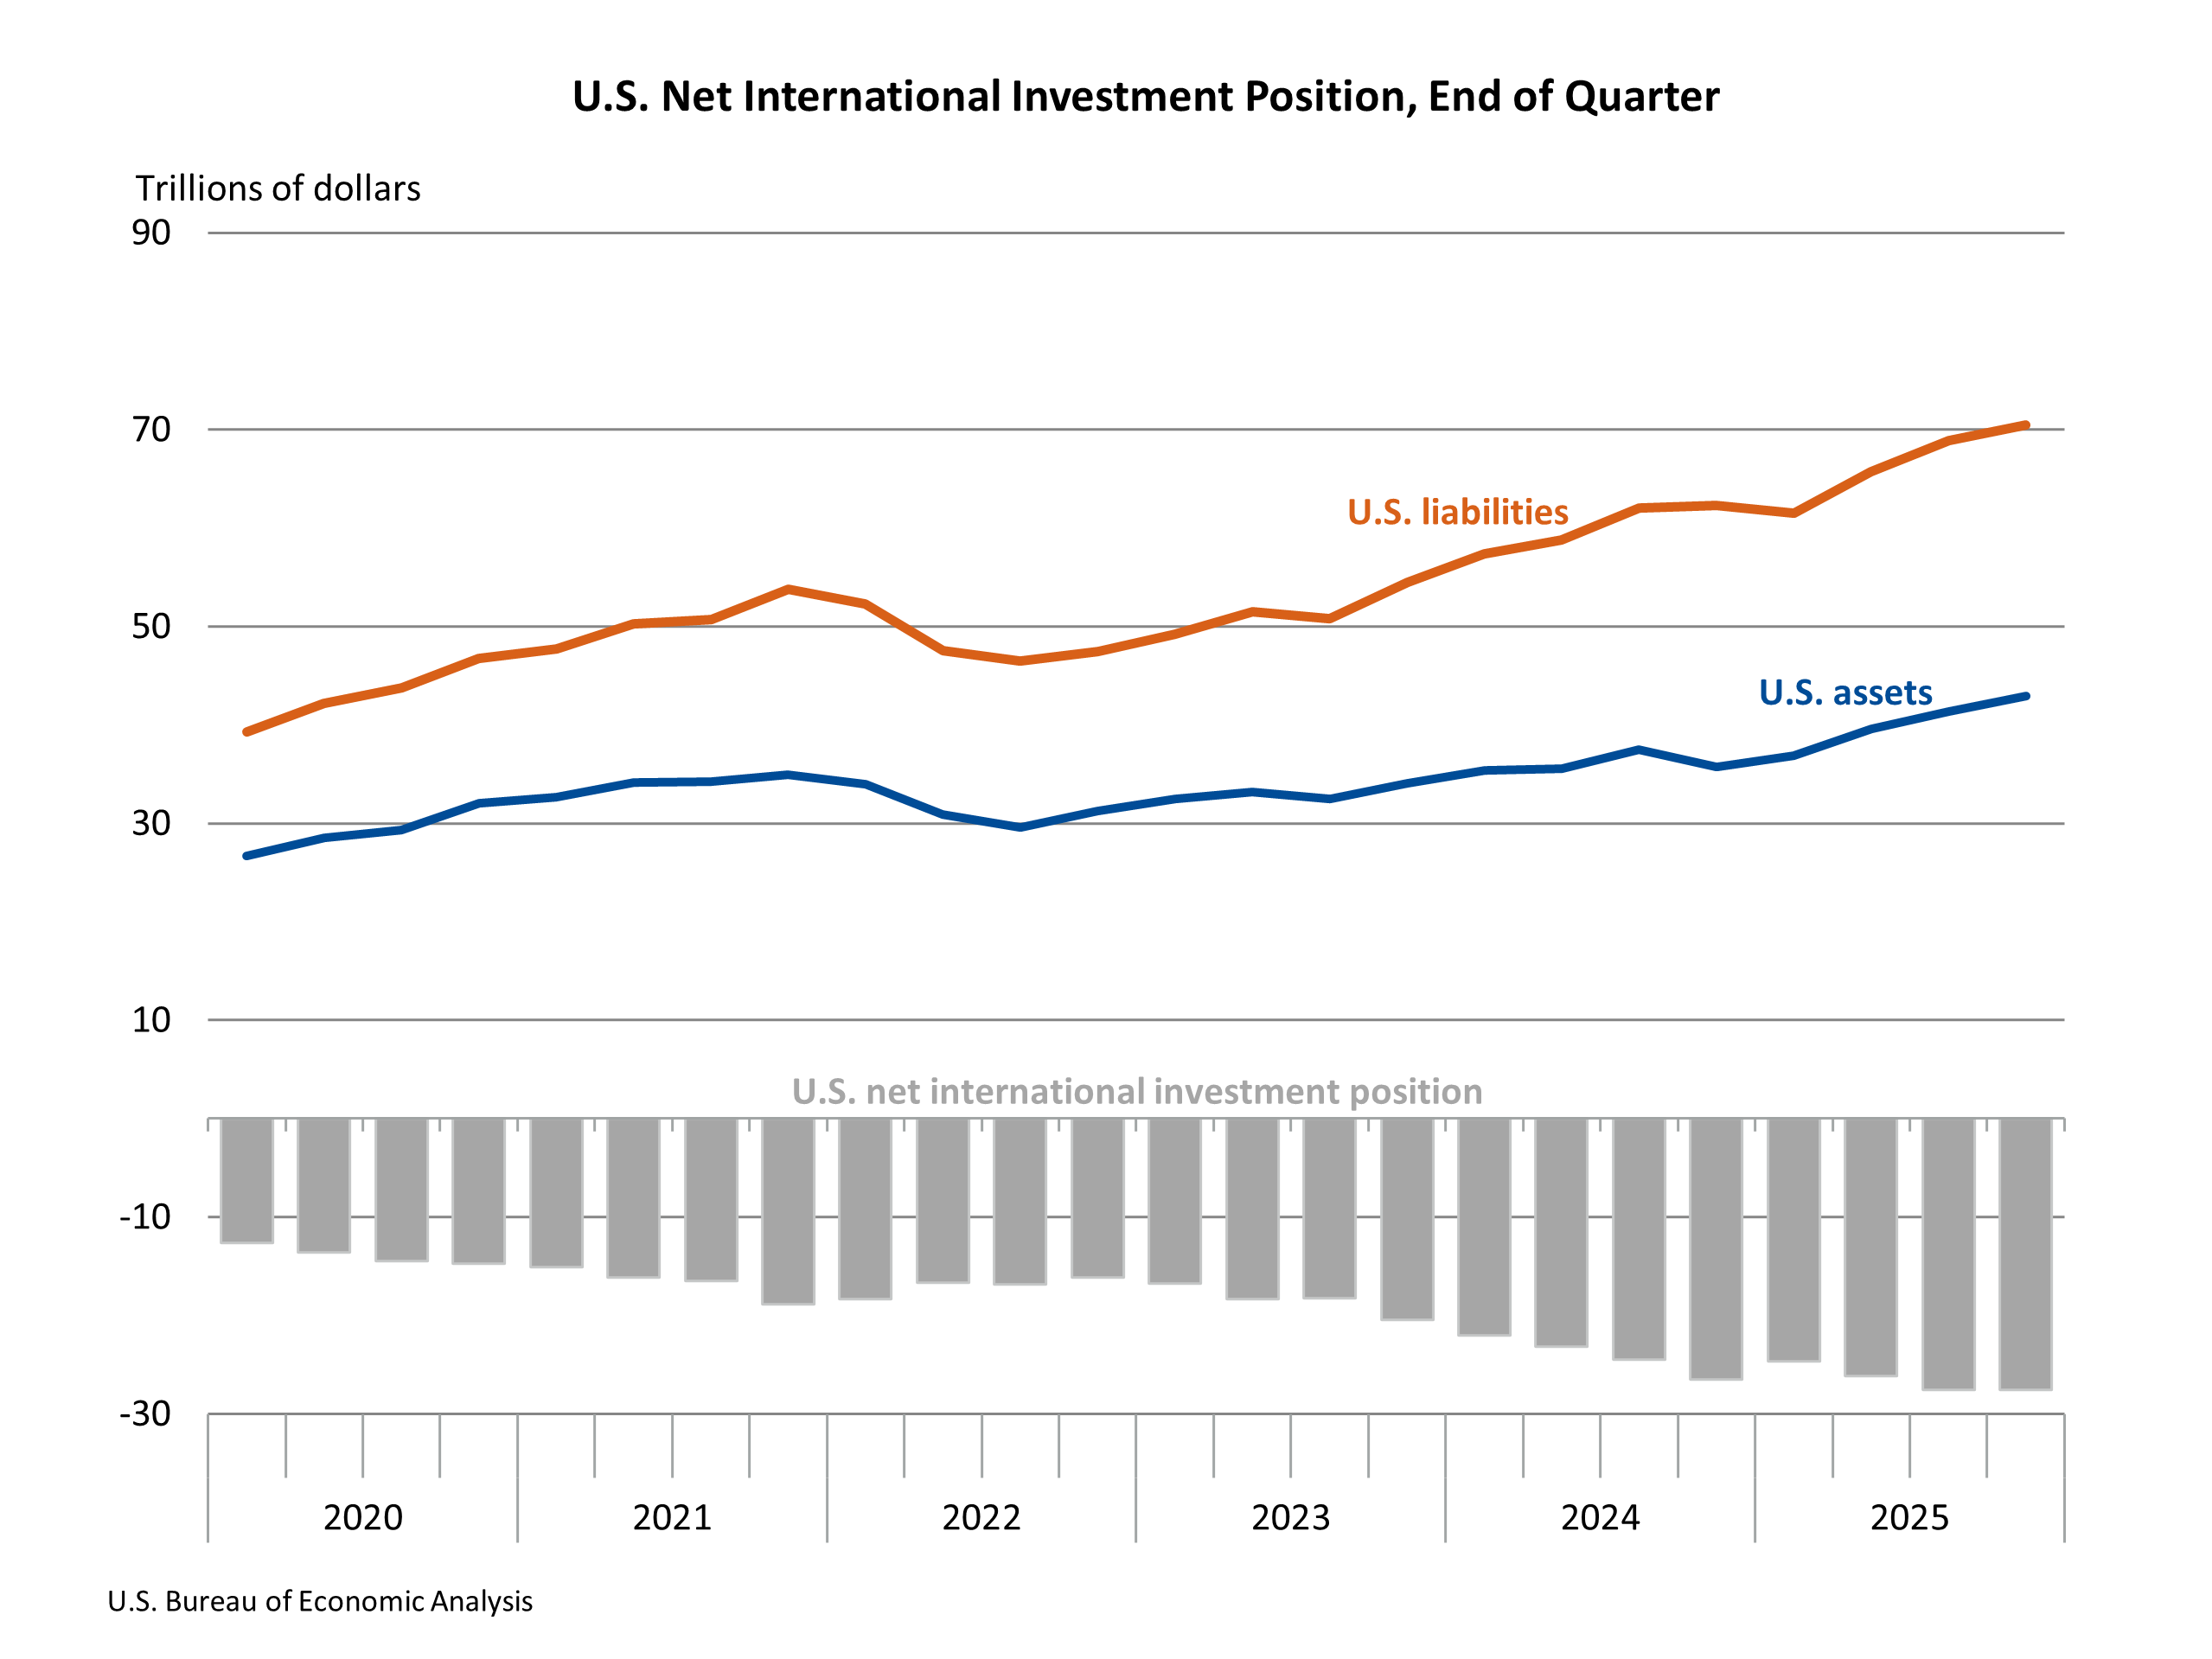
End of Q4 2025 | -$27.54 T |
End of Q3 2025 | -$27.55 T |
The U.S. net international investment position, the difference between U.S. residents’ foreign financial assets and liabilities, was –$27.54 trillion at the end of the fourth quarter of 2025. Assets totaled $42.96 trillion, and liabilities totaled $70.49 trillion. At the end of the third quarter, the net investment position was –$27.55 trillion (revised).
- Current Release: March 25, 2026
Next Release: June 24, 2026
Principal Federal Economic Indicators
Noteworthy


The Latest
Delving Inside Global Value Chains: Expanded Data Coming Soon
A blog post from BEA Director Vipin Arora
I’d bet most people have heard of global supply chains. But are you familiar with their fraternal twin, global value chains? I’m guessing not. BEA’s statistics on value chains are an underappreciated tool that can help policymakers and the public better understand supply chains.
U.S. International Transactions and Investment Position, 4th Quarter and Year 2025
The U.S. current-account deficit resulting from international economic transactions narrowed by $48.4 billion, or 20.2 percent, to $190.7 billion in the fourth quarter of 2025, according to statistics released today by the U.S. Bureau of Economic Analysis. The revised third-quarter deficit was $239.1 billion. The fourth-quarter deficit was 2.4 percent of current-dollar gross domestic product, down from 3.1 percent in the third quarter.
State Personal Income: More Than a Critical Economic Measure
A blog from BEA Director Vipin Arora
It’s widely recognized that BEA’s economic statistics are among the world’s most closely watched. That’s because our data about trade, consumer prices, and economic activity underpin decisions about interest rates and trade policy, taxes and spending, hiring and investing, and more. You might, however, be unaware that BEA data are also used in allocating hundreds of billions in federal funds…
A Continual Quest for Improving Data Quality
A blog post from BEA Director Vipin Arora
I wouldn’t imagine the phrase “data quality” stirs the imagination of many people. I get it. Artificial intelligence or big data—or even e-commerce, to take it back a few years—sound more exciting. Our team at BEA, however, gets fired up about data quality, especially improving data quality. That’s great, you might be thinking, but what exactly do you mean by data quality?
GDP (Second Estimate), 4th Quarter and Year 2025
Real gross domestic product (GDP) increased at an annual rate of 0.7 percent in the fourth quarter of 2025 (October, November, and December), according to the second estimate released today by the U.S. Bureau of Economic Analysis. In the third quarter, real GDP increased 4.4 percent. The contributors to the increase in real GDP in the fourth quarter were increases in consumer spending and investment. These movements were partly offset by…
Personal Income and Outlays, January 2026
Personal income increased $113.8 billion (0.4 percent at a monthly rate) in January, according to estimates released today by the U.S. Bureau of Economic Analysis. Disposable personal income (DPI)—personal income less personal current taxes—increased $219.9 billion (0.9 percent), and personal consumption expenditures (PCE) increased $81.1 billion (0.4 percent). Personal outlays—the sum of PCE, personal interest payments, and personal current…
U.S. International Trade in Goods and Services, January 2026
The U.S. monthly international trade deficit decreased in January 2026 according to the U.S. Bureau of Economic Analysis and the U.S. Census Bureau. The deficit decreased from $72.9 billion in December (revised) to $54.5 billion in January, as exports increased and imports decreased. The goods deficit decreased $17.5 billion in January to $81.8 billion. The services surplus increased $1.0 billion in January to $27.3 billion.
Outdoor Recreation Economic Statistics, U.S. and States, 2024
The value added of the outdoor recreation economy accounted for 2.4 percent ($696.7 billion) of current-dollar gross domestic product (GDP) for the nation in 2024. Across states and the District of Columbia, value added for outdoor recreation as a share of state GDP ranged from 6.1 percent in Hawaii to 1.0 percent in the District of Columbia.
Granularity: Even More Economic Detail Coming Your Way
A blog post from BEA Director Vipin Arora
We use the word “granular” a lot at BEA. It’s not a term that comes up much in day-to-day conversation elsewhere. When I first started hearing it here regularly, I always pictured salt. As in granulated salt. That isn’t crazy—apparently granularity first entered the English language in the 17th century to describe texture. It’s slowly evolved to mean level of detail, which is how we use…
Economic Release Schedule Update
SUITLAND, Md. – The following update to BEA’s post-shutdown economic release schedule is currently available:
U.S. International Trade in Goods and Services, January 2026, will be released March 12 at 8:30 a.m. These data were originally scheduled for release on March 5.
See BEA’s full economic release schedule on our website.