
News Release
U.S. International Investment Position, 1st quarter 2018, Year 2017, and annual update
First Quarter 2018
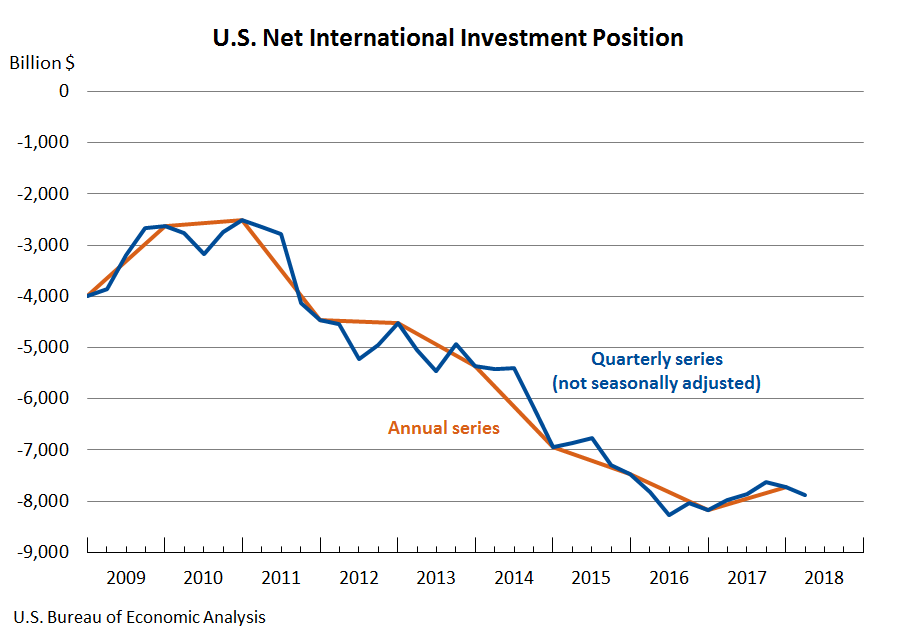
The U.S. net international investment position decreased to -$7,888.1 billion (preliminary) at the end of the first quarter of 2018 from -$7,725.0 billion (revised) at the end of the fourth quarter of 2017, according to statistics released by the Bureau of Economic Analysis (BEA). The $163.1 billion decrease reflected a $182.8 billion decrease in U.S. assets and a $19.7 billion decrease in U.S. liabilities (table 1).
The $163.1 billion decrease in the net investment position reflected net financial transactions of –$164.8 billion and net other changes in position, such as price and exchange-rate changes, of $1.7 billion (table A).
The net investment position decreased 2.1 percent in the first quarter, compared with a decrease of 1.3 percent in the fourth quarter. The net investment position decreased an average of 4.7 percent from the first quarter of 2011 through the third quarter of 2017.
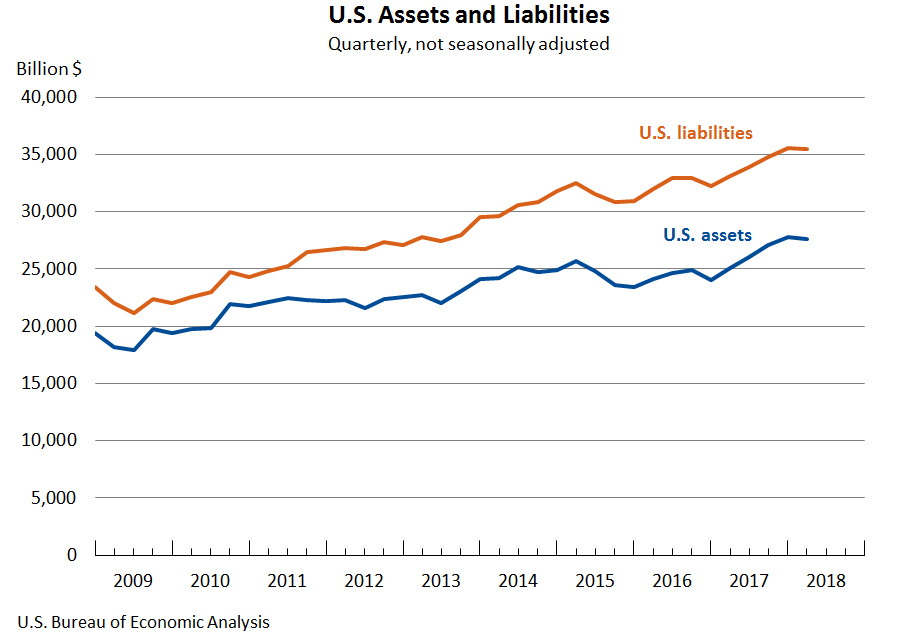
U.S. assets decreased $182.8 billion to $27,616.3 billion at the end of the first quarter, mostly reflecting a decrease in direct investment assets that was partly offset by an increase in portfolio investment assets.
- Assets excluding financial derivatives decreased $171.9 billion to $26,004.7 billion. The decrease resulted from other changes in position of –$440.8 billion and financial transactions of $268.9 billion (table A).
- Other changes in position were driven by foreign equity price decreases that lowered the value of portfolio investment and direct investment equity assets. These price decreases were partly offset by increases from exchange-rate changes, as major foreign currencies appreciated against the U.S. dollar, raising the value of foreign-currency-denominated assets in dollar terms.
- Financial transactions mostly reflected net acquisition of portfolio investment assets that was partly offset by net withdrawal of direct investment assets. The net withdrawal of direct investment assets resulted from U.S. parent repatriation of previously reinvested earnings. For more information on the repatriation, see the box “Effects of the 2017 Tax Cuts and Jobs Act on Components of Direct Investment.”
- Financial derivatives decreased $10.9 billion to $1,611.6 billion, reflecting decreases in single-currency interest rate contracts and foreign exchange contracts.
| Position, 2017:IV | Change in position in 2018:I | Position, 2018:I | |||
|---|---|---|---|---|---|
| Total | Attributable to: | ||||
| Financial transactions | Other changes in position 1 | ||||
| U.S. net international investment position | -7,725.0 | -163.1 | -164.8 | 1.7 | -7,888.1 |
| Net position excluding financial derivatives | -7,753.3 | -185.3 | -193.5 | 8.1 | -7,938.6 |
| Financial derivatives other than reserves, net | 28.3 | 22.3 | 28.7 | -6.4 | 50.5 |
| U.S. assets | 27,799.1 | -182.8 | (2) | (2) | 27,616.3 |
| Assets excluding financial derivatives | 26,176.6 | -171.9 | 268.9 | -440.8 | 26,004.7 |
| Financial derivatives other than reserves | 1,622.5 | -10.9 | (2) | (2) | 1,611.6 |
| U.S. liabilities | 35,524.1 | -19.7 | (2) | (2) | 35,504.4 |
| Liabilities excluding financial derivatives | 33,929.8 | 13.5 | 462.4 | -448.9 | 33,943.3 |
| Financial derivatives other than reserves | 1,594.2 | -33.2 | (2) | (2) | 1,561.0 |
| 1 Disaggregation of other changes in position into price changes, exchange-rate changes, and other changes in volume and valuation is only presented for annual statistics (see table B and table 2 in this release). | |||||
| 2 Financial transactions and other changes in financial derivatives positions are available only on a net basis; they are not separately available for U.S. assets and U.S. liabilities. | |||||
U.S. liabilities decreased $19.7 billion to $35,504.4 billion at the end of the first quarter, reflecting decreases in direct investment, financial derivatives, and portfolio investment liabilities.
- Financial derivatives decreased $33.2 billion to $1,561.0 billion, reflecting decreases in single-currency interest rate contracts and foreign exchange contracts.
- Liabilities excluding financial derivatives increased $13.5 billion to $33,943.3 billion. The increase resulted from financial transactions of $462.4 billion and other changes in position of –$448.9 billion (table A).
- Financial transactions reflected net incurrence of liabilities in all major investment categories, especially in portfolio investment.
- Other changes in position were driven by U.S. equity and bond price decreases that lowered the value of portfolio investment liabilities. Equity price decreases also lowered the value of direct investment equity liabilities.
Effects of the 2017 Tax Cuts and Jobs Act on Components of Direct Investment
The earnings of foreign affiliates of U.S. multinational enterprises consist of repatriated earnings to the parent company in the United States in the form of dividends and reinvested earnings in foreign affiliates. When dividends exceed earnings in a given period, there is a net withdrawal of direct investment equity assets. The net withdrawal in the first quarter of 2018 reflects the repatriation of accumulated earnings by foreign affiliates to their U.S. parent companies in response to the 2017 Tax Cuts and Jobs Act (TCJA). The TCJA requires U.S. parent companies to pay a one-time tax on their accumulated earnings held abroad, but generally eliminates taxes on repatriated earnings.
The financial transactions highlighted in this release and related income transactions are reflected in the U.S. international transactions accounts. For more information about how the TCJA affected direct investment asset and income transactions, see “U.S. International Transactions: First Quarter 2018 and Annual Update,” which was released on June 20, 2018, and two BEA FAQs “How are the international transactions accounts affected by an increase in direct investment dividend receipts?” and “How does the 2017 Tax Cuts and Jobs Act affect BEA's business income statistics?”
Annual Update
The statistics in this release reflect the annual update of the U.S. net international investment position (table 3). With this update, BEA has incorporated improved estimation methodologies and newly available and revised source data. Key changes to the statistics and the results of the annual update for 2017 are highlighted below.
- The revised statistics for the net international investment position incorporate newly available and revised source data for 2014–2017.
- Revised statistics on direct investment positions and transactions in financial assets and liabilities for 2014–2017 incorporate the results of BEA’s 2014 Benchmark Survey of U.S. Direct Investment Abroad. This survey collects data on the U.S. and foreign operations of all U.S. investors that own 10 percent or more of a foreign business enterprise. For more information, see “Activities of U.S. Multinational Enterprises in the United States and Abroad: Preliminary Results From the 2014 Benchmark Survey” in the December 2016 issue of the Survey of Current Business.
- Revised statistics on portfolio investment positions for 2016–2017 incorporate the results of the U.S. Department of Treasury’s 2016 Benchmark Survey of U.S. Ownership of Foreign Securities and 2017 Annual Survey of Foreign-Residents’ Holdings of U.S. Securities.
- The revised statistics for the net international investment position also incorporate revisions to trade credit and advances, a component of other investment liabilities, beginning with statistics for 2010. The revisions result from an improved method for estimating exports under the U.S. Foreign Military Sales (FMS) program in the U.S. international transactions accounts (ITAs). This change in methodology also affects U.S. liabilities in the ITAs and in the international investment position accounts because the value of exports of FMS goods is recorded under general government trade credit and advances as a reduction in the liabilities of the U.S. government. U.S. government liabilities, which reflect pre-payments made by foreign purchasers, are reduced when the foreign purchaser takes ownership of the goods.
| Agency | Data | Years affected |
|---|---|---|
| BEA | Benchmark Survey of U.S. Direct Investment Abroad | 2014–2017 |
| Quarterly direct investment surveys | 2015–2017 | |
| Annual direct investment surveys | 2015–2016 | |
U.S. Department of the Treasury |
Aggregate Holdings of Long-Term Securities by U.S. and Foreign Residents | 2014–2017 |
| Foreign-Residents’ Holdings of U.S. Securities, including Selected Money Market Instruments | 2017 | |
| U.S. Ownership of Foreign Securities, including Selected Money Market Instruments | 2016–2017 | |
| Reports by Financial Institutions of Liabilities to, and Claims on, Foreign Residents by U.S. Residents | 2014–2017 | |
| Reports of Liabilities to, and Claims on, Unaffiliated Foreign Residents by U.S. Resident Non-Financial Institutions | 2014–2017 | |
| Reports of Holdings of, and Transactions in, Financial Derivatives Contracts with Foreign Residents | 2014–2017 |
A more detailed discussion of the new estimation methodologies and other changes appears in “Preview of the 2018 Annual Update of the International Economic Accounts” in the May 2018 issue of the Survey of Current Business. Additional information on the updates to the U.S. international investment position accounts and the U.S. international transactions accounts will be provided in the July issue of the Survey of Current Business.
Annual Update for 2017
The U.S. net international investment position increased to -$7,725.0 billion (revised) at the end of 2017 from -$8,181.6 billion (revised) at the end of 2016. The $456.6 billion increase reflected a $3,738.5 billion increase in U.S. assets and a $3,281.9 billion increase in U.S. liabilities (table 2).
The $456.6 billion increase in the net investment position reflected net financial transactions of –$331.9 billion and net other changes in position, such as price and exchange-rate changes, of $788.4 billion (table B).
The net investment position increased 5.6 percent in 2017, compared with a decrease of 9.6 percent in 2016.
U.S. assets increased $3,738.5 billion to $27,799.1 billion at the end of 2017, mostly reflecting increases in portfolio investment and direct investment assets that were partly offset by a decrease in financial derivatives.
- Assets excluding financial derivatives increased $4,336.5 billion to $26,176.6 billion. The increase resulted from other changes in position of $3,153.7 billion and financial transactions of $1,182.7 billion (table B).
- Other changes in position mostly reflected (1) foreign equity price increases that raised the value of portfolio investment and direct investment equity assets and (2) the appreciation of major foreign currencies against the U.S. dollar that raised the value of foreign-currency-denominated assets in dollar terms.
- Financial transactions reflected net acquisition of assets in all major investment categories except reserve assets.
- Financial derivatives decreased $598.0 billion to $1,622.5 billion, reflecting decreases in single-currency interest rate contracts and foreign exchange contracts.
U.S. liabilities increased $3,281.9 billion to $35,524.1 billion at the end of 2017, mostly reflecting increases in portfolio investment and direct investment liabilities that were partly offset by a decrease in financial derivatives.
- Liabilities excluding financial derivatives increased $3,849.9 billion to $33,929.8 billion. The increase resulted from other changes in position of $2,312.3 billion and financial transactions of $1,537.7 billion (table B)
- Other changes in position mostly reflected U.S. equity price increases that raised the value of portfolio investment and direct investment equity liabilities.
- Financial transactions reflected net incurrence of liabilities in all major investment categories.
- Financial derivatives decreased $568.1 billion to $1,594.2 billion, reflecting decreases in single-currency interest rate contracts and foreign exchange contracts.
| Position, 2016 | Change in position in 2017 | Position, 2017 | ||||||
|---|---|---|---|---|---|---|---|---|
| Total | Attributable to: | |||||||
| Financial transactions | Other changes in position | |||||||
| Total | Price changes | Exchange-rate changes | Changes in volume and valuation n.i.e. | |||||
| U.S. net investment position | -8,181.6 | 456.6 | -331.9 | 788.4 | (1) | (1) | (1) | -7,725.0 |
| Net position excl. derivatives | -8,239.8 | 486.5 | -354.9 | 841.4 | -349.6 | 1,176.2 | 14.9 | -7,753.3 |
| Financial derivatives, net | 58.2 | -29.9 | 23.1 | -53.0 | (1) | (1) | (1) | 28.3 |
| U.S. assets | 24,060.6 | 3,738.5 | (2) | (2) | (2) | (2) | (2) | 27,799.1 |
| Assets excl. derivatives | 21,840.1 | 4,336.5 | 1,182.7 | 3,153.7 | 1,837.9 | 1,280.2 | 35.6 | 26,176.6 |
| Financial derivatives | 2,220.5 | -598.0 | (2) | (2) | (2) | (2) | (2) | 1,622.5 |
| U.S. liabilities | 32,242.2 | 3,281.9 | (2) | (2) | (2) | (2) | (2) | 35,524.1 |
| Liabilities excl. derivatives | 30,079.9 | 3,849.9 | 1,537.7 | 2,312.3 | 2,187.6 | 104.0 | 20.7 | 33,929.8 |
| Financial derivatives | 2,162.3 | -568.1 | (2) | (2) | (2) | (2) | (2) | 1,594.2 |
| 1 Data are not separately available for price changes, exchange-rate changes, and changes in volume and valuation not included elsewhere. | ||||||||
| 2 Financial transactions and other changes in financial derivatives positions are available only on a net basis; they are not separately available for U.S. assets and U.S. liabilities. | ||||||||
Next release: September 26, 2018, at 8:30 A.M. EDT
U.S. Net International Investment Position, Second Quarter 2018