
News Release
U.S. Net International Investment Position: First Quarter 2019, Year 2018, and Annual Update
First Quarter 2019
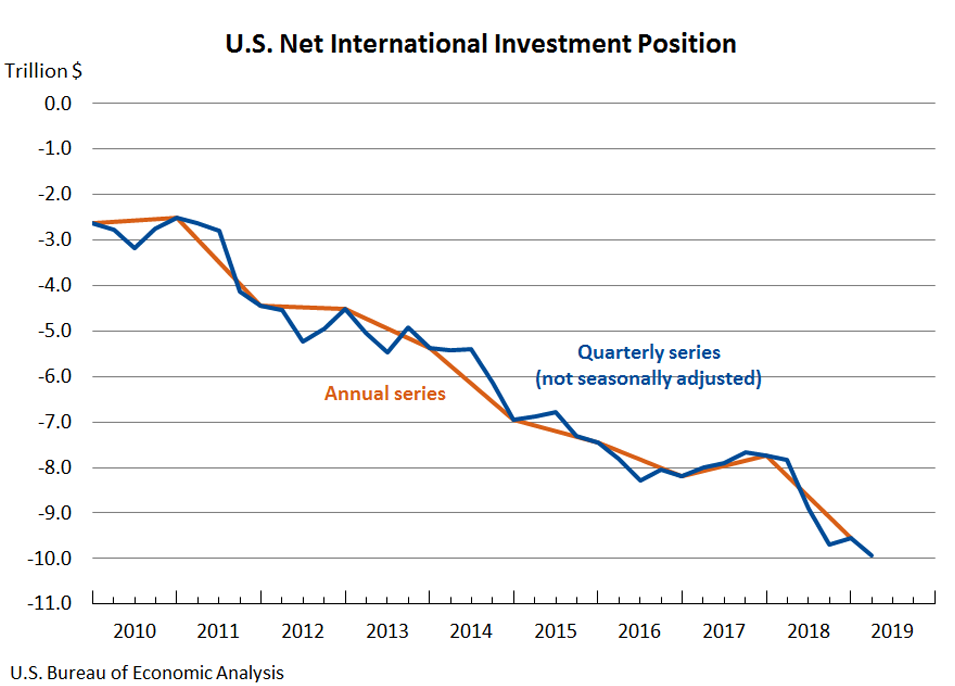
The U.S. net international investment position decreased to −$9.93 trillion (preliminary) at the end of the first quarter of 2019 from −$9.55 trillion (revised) at the end of the fourth quarter of 2018, according to statistics released by the Bureau of Economic Analysis (BEA). The $374.4 billion decrease reflected a $1.90 trillion increase in U.S. assets and a $2.27 trillion increase in U.S. liabilities (table 1).
The $374.4 billion decrease in the net investment position also reflected net financial transactions of –$30.2 billion and net other changes in position, such as price and exchange-rate changes, of –$344.2 billion (table A).
The net investment position decreased 3.9 percent in the first quarter of 2019, compared with an increase of 1.5 percent in the fourth quarter of 2018.
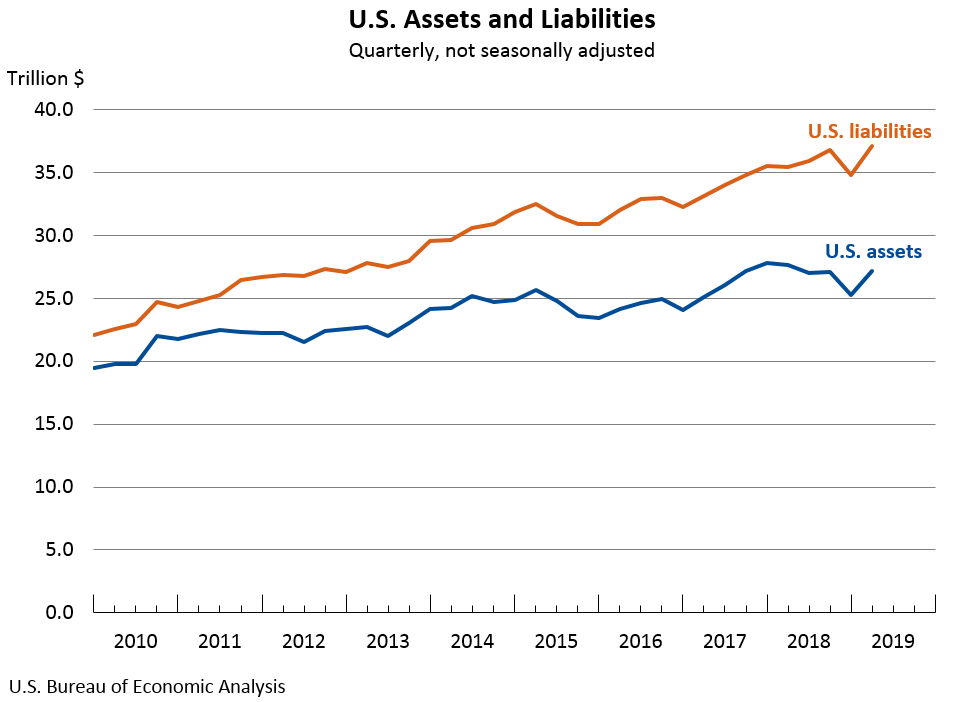
U.S. assets increased $1.90 trillion to $27.14 trillion at the end of the first quarter, reflecting increases in all major categories of assets, particularly in portfolio investment and direct investment assets.
- Assets excluding financial derivatives increased $1.83 trillion to $25.58 trillion. The increase resulted from financial transactions of $157.4 billion and other changes in position of $1.68 trillion (table A).
- Financial transactions reflected net U.S. acquisitions of other investment loan assets, direct investment equity assets, and foreign debt securities that were partly offset by net U.S. sales of foreign stocks.
- Other changes in position were driven by foreign stock price increases that raised the equity value of portfolio investment and direct investment assets.
- Financial derivatives increased $62.7 billion to $1.55 trillion, reflecting an increase in single-currency interest rate contracts that was partly offset by a decrease in foreign exchange contracts.
Table A. Quarterly Change in the U.S. Net International Investment Position
Billions of dollars, not seasonally adjusted
| Position, 2018:IV |
Change in position in 2019:I | Position, 2019:I |
|||
| Total | Attributable to: | ||||
| Financial transactions |
Other changes in position 1 |
||||
| U.S. net international investment position | -9,554.7 | -374.4 | -30.2 | -344.2 | -9,929.1 |
| Net position excluding financial derivatives | -9,592.4 | -367.4 | -8.7 | -358.6 | -9,959.8 |
| Financial derivatives other than reserves, net | 37.7 | -7.0 | -21.4 | 14.4 | 30.6 |
| U.S. assets | 25,241.5 | 1,896.1 | (2) | (2) | 27,137.6 |
| Assets excluding financial derivatives | 23,749.2 | 1,833.5 | 157.4 | 1,676.0 | 25,582.7 |
| Financial derivatives other than reserves | 1,492.3 | 62.7 | (2) | (2) | 1,554.9 |
| U.S. liabilities | 34,796.2 | 2,270.5 | (2) | (2) | 37,066.7 |
| Liabilities excluding financial derivatives | 33,341.6 | 2,200.8 | 166.2 | 2,034.6 | 35,542.4 |
| Financial derivatives other than reserves | 1,454.6 | 69.7 | (2) | (2) | 1,524.3 |
| 1. Disaggregation of other changes in position into price changes, exchange-rate changes, and other changes in volume and valuation is only presented for annual statistics (see table B and table 2 in this release). 2. Financial transactions and other changes in financial derivatives positions are available only on a net basis; they are not separately available for U.S. assets and U.S. liabilities. |
|||||
U.S. liabilities increased $2.27 trillion to $37.07 trillion at the end of the first quarter, reflecting increases in all major categories of liabilities, particularly in portfolio investment and direct investment liabilities.
- Liabilities excluding financial derivatives increased $2.20 trillion to $35.54 trillion. The increase resulted from financial transactions of $166.2 billion and other changes in position of $2.03 trillion (table A).
- Financial transactions reflected net foreign purchases of U.S. debt securities and net incurrence of direct investment equity liabilities and other investment loan liabilities. These increases in liabilities were partly offset by net foreign sales of U.S. stocks and net foreign withdrawal of deposits.
- Other changes in position were driven by U.S. stock price increases that raised the equity value of portfolio investment and direct investment liabilities.
- Financial derivatives increased $69.7 billion to $1.52 trillion, reflecting an increase in single-currency interest rate contracts that was partly offset by a decrease in foreign exchange contracts.
Annual Update
The statistics in this release reflect the annual update of the U.S. net international investment position (table 3). With this update, BEA has incorporated newly available and revised source data for 2016-2018 for most statistical series. The exceptions are direct investment positions and financial transactions, for which BEA has incorporated newly available and revised survey data for 2018 only. The incorporation of updated direct investment survey data for 2016 and 2017 was delayed until 2020 because of the impact of the partial government shutdown that started in December 2018.
Newly Available and Revised Source Data: Key Providers and Years Affected
Additional information on the update to the U.S. international investment position accounts will be provided in the July issue of the Survey of Current Business.
Annual Update for 2018
The U.S. net international investment position decreased to –$9.55 trillion (revised) at the end of 2018 from –$7.74 trillion (revised) at the end of 2017. The $1.81 trillion decrease reflected a $2.53 trillion decrease in U.S. assets and a $719.9 billion decrease in U.S. liabilities (table B and table 2).
The decrease in the net investment position also reflected net financial transactions of –$445.5 billion and net other changes in position, such as price and exchange-rate changes, of –$1.37 trillion.
The net investment position decreased 23.4 percent in 2018, compared with an increase of 5.5 percent in 2017.
U.S. assets decreased $2.53 trillion to $25.24 trillion at the end of 2018, mostly reflecting decreases in foreign stock prices that lowered the equity value of direct investment and portfolio investment assets. The decrease in direct investment assets also reflected U.S. parent repatriation of previously reinvested earnings in response to the Tax Cuts and Jobs Act. For more information, see the box "Effects of the 2017 Tax Cuts and Jobs Act on U.S. Direct Investment Assets."
Table B. Annual Change in the U.S. Net International Investment Position
Billions of dollars
| Position, 2017 |
Change in position in 2018 | Position, 2018 |
|||||||
| Total | Attributable to: | ||||||||
| Financial transactions |
Other changes in position | ||||||||
| Total | Price changes | Exchange-rate changes | Changes in volume and valuation n.i.e |
||||||
| U.S. net international investment position | -7,743.2 | -1,811.5 | -445.5 | -1,366.0 | (1) | (1) | (1) | -9,554.7 | |
| Net position excluding financial derivatives | -7,780.9 | -1,811.5 | -424.8 | -1,386.8 | -389.9 | -663.3 | -333.5 | -9,592.4 | |
| Financial derivatives other than reserves, net | 37.6 | (*) | -20.7 | 20.8 | (2) | (2) | (2) | 37.7 | |
| U.S. assets | 27,772.9 | -2,531.4 | (2) | (2) | (2) | (2) | (2) | 25,241.5 | |
| Assets excluding financial derivatives | 26,212.0 | -2,462.8 | 310.8 | -2,773.7 | -2,035.9 | -719.0 | -18.8 | 23,749.2 | |
| Financial derivatives other than reserves | 1,560.8 | -68.5 | (2) | (2) | (2) | (2) | (2) | 1,492.3 | |
| U.S. liabilities | 35,516.1 | -719.9 | (2) | (2) | (2) | (2) | (2) | 34,796.2 | |
| Liabilities excluding financial derivatives | 33,992.9 | -651.3 | 735.6 | -1,386.9 | -1,646.0 | -55.7 | 314.8 | 33,341.6 | |
| Financial derivatives other than reserves | 1,523.2 | -68.6 | (2) | (2) | (2) | (2) | (2) | 1,454.6 | |
| (*) Value between zero and +/- $50 million. 1. Data are not separately available for price changes, exchange-rate changes, and changes in volume and valuation n.i.e. (not included elsewhere). 2. Financial transactions and other changes in financial derivatives positions are available only on a net basis; they are not separately available for U.S. assets and U.S. liabilities. |
|||||||||
U.S. liabilities decreased $719.9 billion to $34.80 trillion at the end of 2018, mostly reflecting decreases in U.S. stock prices that lowered the equity value of direct investment and portfolio investment liabilities. The $332.3 billion value recorded in changes in volume and valuation n.i.e. (not included elsewhere) for other investment loan liabilities mostly reflected improved reporting on surveys administered by the U.S. Department of Treasury; for more information see the technical note on "Improved Reporting of U.S. Loan Liabilities to Foreign Collateralized Loan Obligations."
The earnings of foreign affiliates of U.S. multinational enterprises consist of repatriated earnings to the parent company in the United States in the form of dividends and reinvested earnings in foreign affiliates. When dividends exceed earnings in a given period, reinvested earnings (calculated as a residual) are negative, indicating a withdrawal of equity assets. In 2018, the $151.6 billion net withdrawal of direct investment equity assets reflected reinvested earnings of −$229.7 billion that were partly offset by net U.S. acquisition of equity other than reinvested earnings of $78.0 billion. The net withdrawal of direct investment equity assets in 2018 reflected the repatriation of accumulated prior earnings of foreign affiliates by their U.S. parent companies as dividends, in response to the 2017 Tax Cuts and Jobs Act (TCJA), which generally eliminated taxes on repatriated earnings.
The financial transactions highlighted in this release and related income transactions are reflected in the U.S. international transactions accounts. For more information about how the TCJA affected direct investment asset and income transactions, see "U.S. International Transactions: First Quarter 2019 and Annual Update," which was released on June 20, 2019, and two BEA FAQs "How are the international transactions accounts affected by an increase in direct investment dividend receipts?" and "How does the 2017 Tax Cuts and Jobs Act affect BEA's business income statistics?".
Next release: September 30, 2019, at 8:30 A.M. EDT
U.S. Net International Investment Position, Second Quarter 2019