
News Release
U.S. International Transactions, First Quarter 2019 and Annual Update
Current-Account Balance
The U.S. current-account deficit decreased to $130.4 billion (preliminary) in the first quarter of 2019 from $143.9 billion (revised) in the fourth quarter of 2018, according to statistics released by the Bureau of Economic Analysis (BEA). The deficit was 2.5 percent of current-dollar gross domestic product in the first quarter, down from 2.8 percent in the fourth quarter.
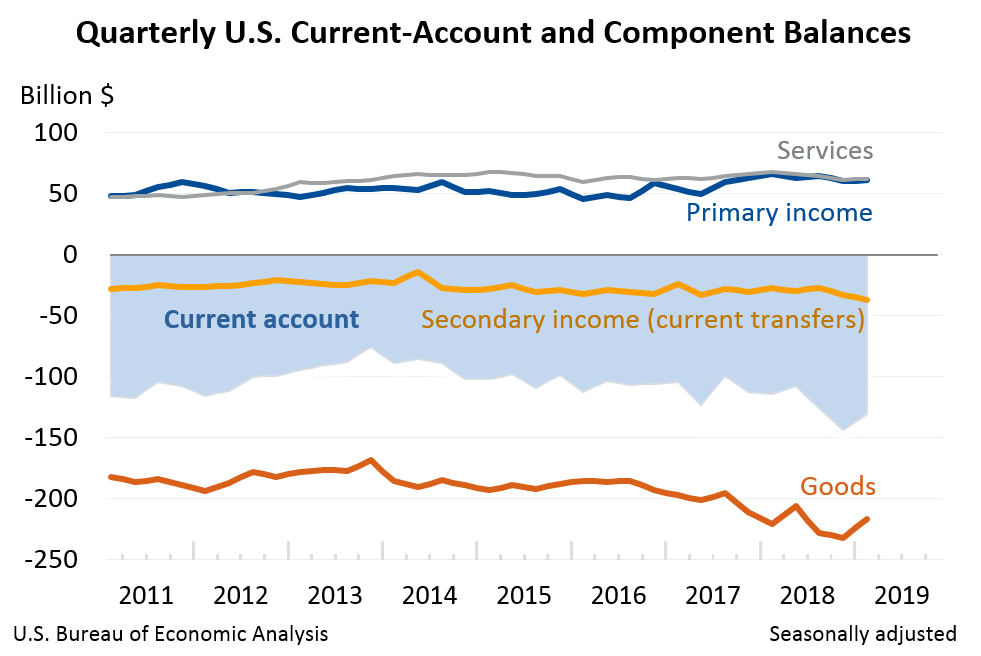
The $13.5 billion decrease in the current-account deficit mostly reflected a decrease in the deficit on goods that was partly offset by an increase in the deficit on secondary income.
Current-Account Transactions (tables 1-5)
Exports of goods and services and income receipts
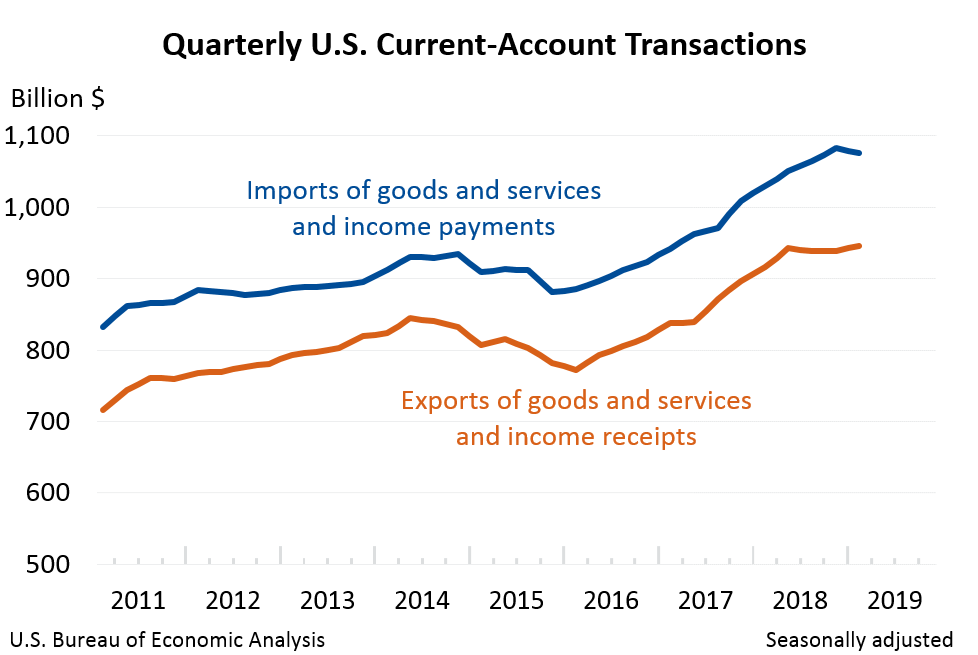
Exports of goods and services and income receipts increased $7.2 billion in the first quarter to $945.9 billion.
- Primary income receipts increased $5.3 billion to $281.8 billion, primarily reflecting increases in direct investment income and in other investment income. A decrease in portfolio investment income partly offset the increases. For more information on direct investment income, see "Effects of the 2017 Tax Cuts and Jobs Act on Components of the International Transactions Accounts."
- Goods exports increased $2.4 billion to $419.3 billion, primarily reflecting increases in automotive vehicles, parts, and engines, mostly passenger cars, and in foods, feeds, and beverages, mainly soybeans. A decrease in industrial supplies and materials partly offset the increases.
- Services exports increased $2.3 billion to $209.1 billion, primarily reflecting an increase in travel (for all purposes including education), mostly personal travel.
- Secondary income receipts decreased $2.8 billion to $35.6 billion, reflecting decreases in both private and U.S. government transfers.
Imports of goods and services and income payments
Imports of goods and services and income payments decreased $6.3 billion in the first quarter to $1.08 trillion.
- Goods imports decreased $13.4 billion to $635.9 billion, primarily reflecting a decrease in industrial supplies and materials, mainly petroleum and products.
- Primary income payments increased $4.3 billion to $220.7 billion, primarily reflecting an increase in direct investment income.
Effects of the 2017 Tax Cuts and Jobs Act on Components of the International Transactions Accounts
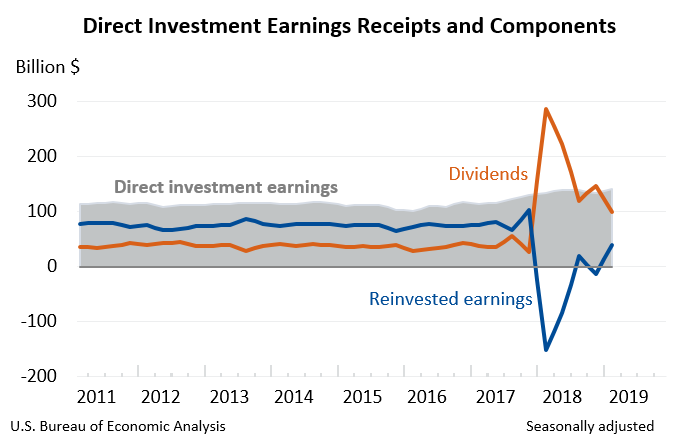
In the international transactions accounts, income on equity, or earnings, of foreign affiliates of U.S. multinational enterprises consists of a portion that is repatriated to the parent company in the United States in the form of dividends and a portion that is reinvested in foreign affiliates. In response to the 2017 Tax Cuts and Jobs Act, which generally eliminated taxes on repatriated earnings, some U.S. multinational enterprises repatriated accumulated prior earnings of their foreign affiliates. In the first, second, and fourth quarters of 2018, the repatriation of dividends exceeded current-period earnings, resulting in negative values being recorded for reinvested earnings. In the first quarter of 2019, dividends were $100.2 billion while reinvested earnings were $40.2 billion (see table below). The reinvested earnings are also reflected in the net acquisition of direct investment assets in the financial account (table 6). For more information, see "How does the 2017 Tax Cuts and Jobs Act affect BEA’s business income statistics?" and "How are the international transactions accounts affected by an increase in direct investment dividend receipts?"
| Direct Investment Earnings Receipts Billions of dollars, seasonally adjusted |
||||||||||
| 2017 | 2018 | 2019 | ||||||||
| Ir | IIr | IIIr | IVr | Ir | IIr | IIIr | IVr | Ip | ||
|---|---|---|---|---|---|---|---|---|---|---|
| Direct investment earnings | 114.7 | 115.4 | 122.2 | 130.7 | 134.3 | 139.4 | 139.2 | 134.0 | 140.5 | |
| Dividends | 38.2 | 34.9 | 55.1 | 26.9 | 285.9 | 223.8 | 120.2 | 146.6 | 100.2 | |
| Reinvested earnings | 76.5 | 80.5 | 67.1 | 103.8 | −151.6 | −84.4 | 18.9 | −12.6 | 40.2 | |
| p Preliminary | r Revised | ||||||||||
Capital Account, Fourth Quarter (table 1)
There were no capital-account transactions recorded in the first quarter, following receipts of $2.7 billion in the fourth quarter. The fourth-quarter transactions reflected receipts from foreign insurance companies for losses resulting from the wildfires in California. For information on transactions associated with natural disasters, see "What are the effects of hurricanes and other disasters on the international economic accounts?"
Financial Account (tables 1, 6, 7, and 8)
Net U.S. borrowing measured by financial-account transactions was $37.8 billion in the first quarter, a decrease from net borrowing of $161.6 billion in the fourth quarter.
Financial assets
Net U.S. acquisition of financial assets excluding financial derivatives increased $4.3 billion in the first quarter to $151.6 billion.
- Net U.S. acquisition of direct investment assets increased $33.8 billion to $59.5 billion. For more information on recent transactions in direct investment assets, see "Effects of the 2017 Tax Cuts and Jobs Act on Components of the International Transactions Accounts."
- Net U.S. acquisition of other investment assets increased $9.9 billion to $151.6 billion, reflecting an increase in net U.S. provision of loans to foreign residents that was mostly offset by a decrease in net U.S acquisition of currency and deposits.
- Net U.S. sales of portfolio investment assets increased $37.5 billion to $59.7 billion, reflecting net U.S. sales of foreign stocks following net U.S. purchases in the fourth quarter.
Liabilities
Net U.S. incurrence of liabilities excluding financial derivatives decreased $118.3 billion in the first quarter to $167.9 billion.
- Net U.S. incurrence of other investment liabilities decreased $148.5 billion to $70.2 billion, mostly reflecting net foreign withdrawal of deposits in the United States following a net increase in deposits in the fourth quarter.
- Net foreign sales of U.S. portfolio investment liabilities were $7.7 billion following net foreign purchases of $14.9 billion in the fourth quarter, reflecting relatively large and nearly offsetting changes in U.S. stock and debt security transactions from the fourth to the first quarter.
- Net U.S. incurrence of direct investment liabilities increased $52.7 billion to $105.5 billion, primarily reflecting net U.S. incurrence of debt liabilities following net U.S. repayment in the fourth quarter.
Financial derivatives
Transactions in financial derivatives other than reserves reflected first-quarter net borrowing of $21.4 billion.
Statistical Discrepancy (table 1)
The statistical discrepancy was $92.6 billion in the first quarter following a statistical discrepancy of −$20.4 billion in the fourth quarter.
| Updates to Fourth Quarter 2018 International Transactions Accounts Aggregatess Billions of dollars, seasonally adjusted |
||
| Preliminary estimate | Revised estimate | |
|---|---|---|
| Current-account balance | −134.4 | −143.9 |
| Goods balance | −233.1 | −232.3 |
| Services balance | 66.1 | 61.2 |
| Primary-income balance | 60.4 | 60.1 |
| Secondary-income balance | −27.8 | −32.8 |
| Capital-account balance | 8.9 | 2.7 |
| Net lending (+)/borrowing (–) from financial-account transactions | −168.3 | −161.6 |
| Statistical discrepancy | −42.8 | −20.4 |
Annual Update of the International Transactions Accounts (table 9)
The statistics in this release reflect the annual update of the U.S. international transactions accounts. With this update, BEA has incorporated newly available and revised source data for 2016–2018 for most statistical series. The exceptions are direct investment income and financial transactions, for which BEA has incorporated newly available and revised survey data for 2018 only. The incorporation of updated direct investment survey data for 2016 and 2017 was delayed until 2020 because of the impact of the partial government shutdown that started in December 2018. With this annual update, BEA has also incorporated updated seasonal adjustments for 2014–2018.
Newly Available and Revised Source Data: Key Providers and Years Affected
|
Agency
|
Data
|
Years affected
|
|
BEA
|
Quarterly international services surveys
|
2016–2018
|
|
Quarterly direct investment surveys
|
2018
|
|
|
U.S. Census Bureau
|
Revised source data for Census-basis goods
|
2016–2018
|
|
U.S. Department of the Treasury
|
Annual portfolio investment surveys
|
2017–2018
|
|
Quarterly and monthly portfolio and other investment surveys
|
2016–2018
|
More information, including a discussion of new standard tables that will be introduced with the September 2019 release and changes to existing standard tables that will be introduced with the annual update in 2020, appears in "Preview of the 2019 Annual Update of the International Economic Accounts" in the April 2019 issue of the Survey of Current Business. Additional information on the update to the U.S. international transactions accounts will be provided in the July issue of the Survey of Current Business.
* * *
Next release: September 19, 2019 at 8:30 A.M. EDT
U.S. International Transactions, Second Quarter 2019
* * *