
News Release
Gross Domestic Product, (Third Estimate), GDP by Industry, and Corporate Profits, Fourth Quarter and Year 2020
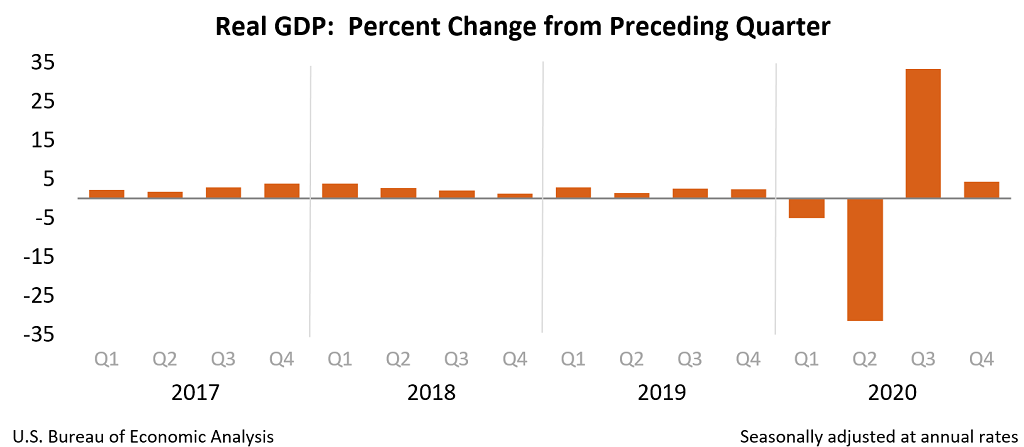
Real gross domestic product (GDP) increased at an annual rate of 4.3 percent in the fourth quarter of 2020 (table 1), according to the "third" estimate released by the Bureau of Economic Analysis. In the third quarter, real GDP increased 33.4 percent.
The "third" estimate of GDP released today is based on more complete source data than were available for the "second" estimate issued last month. In the second estimate, the increase in real GDP was 4.1 percent. The upward revision primarily reflected an upward revision to private inventory investment that was partly offset by a downward revision to nonresidential fixed investment (see "Updates to GDP").
The increase in real GDP reflected increases in exports, nonresidential fixed investment, personal consumption expenditures (PCE), residential fixed investment, and private inventory investment, that were partly offset by decreases in state and local government spending as well as federal government spending (reflecting fewer fees paid to administer the Paycheck Protection Program loans). Imports, which are a subtraction in the calculation of GDP, increased (table 2).
The increase in exports primarily reflected an increase in goods (led by industrial supplies and materials). The increase in nonresidential fixed investment primarily reflected an increase in equipment (led by transportation equipment). The increase in PCE reflected an increase in services (led by health care). The increase in residential fixed investment primarily reflected an increase in single family units. The increase in private inventory investment primarily reflected an increase in manufacturing, including both durable and nondurable goods industries.
Current‑dollar GDP increased 6.3 percent at an annual rate, or $324.4 billion, in the fourth quarter to a level of $21.49 trillion. In the third quarter, GDP increased 38.3 percent, or $1.65 trillion (tables 1 and 3). More information on the source data that underlie the estimates is available in the "Key Source Data and Assumptions" file on BEA's website.
The price index for gross domestic purchases increased 1.7 percent in the fourth quarter, compared with an increase of 3.3 percent in the third quarter (table 4). The PCE price index increased 1.5 percent, compared with an increase of 3.7 percent. Excluding food and energy prices, the PCE price index increased 1.3 percent, compared with an increase of 3.4 percent.
Gross Domestic Income and Corporate Profits
Real gross domestic income (GDI) increased 15.7 percent in the fourth quarter, compared with an increase of 24.1 percent in the third quarter. The average of real GDP and real GDI, a supplemental measure of U.S. economic activity that equally weights GDP and GDI, increased 9.9 percent in the fourth quarter, compared with an increase of 28.7 percent in the third quarter (table 1).
Profits from current production (corporate profits with inventory valuation and capital consumption adjustments) decreased $31.4 billion in the fourth quarter, in contrast to an increase of $499.6 billion in the third quarter (table 10).
Profits of domestic financial corporations increased $17.5 billion in the fourth quarter, compared with an increase of $12.1 billion in the third quarter. Profits of domestic nonfinancial corporations decreased $48.2 billion, in contrast to an increase of $436.2 billion. Rest-of-the-world profits decreased $0.7 billion, in contrast to an increase of $51.3 billion. In the fourth quarter, receipts increased $29.0 billion, and payments increased $29.7 billion.
Updates to GDP
In the third estimate, the change in fourth-quarter real GDP was revised up 0.2 percentage point from the second estimate. The updated estimates primarily reflected upward revisions to private inventory investment and state and local government spending that were partly offset by downward revisions to nonresidential fixed investment and consumer spending. For more information on the updates, see the Technical Note. For information on the GDP update schedule, see the "Additional Information" section that follows.
| Advance Estimate | Second Estimate | Third Estimate | |
|---|---|---|---|
| (Percent change from preceding quarter) | |||
| Real GDP | 4.0 | 4.1 | 4.3 |
| Current-dollar GDP | 6.0 | 6.1 | 6.3 |
| Real GDI | … | … | 15.7 |
| Average of Real GDP and Real GDI | … | … | 9.9 |
| Gross domestic purchases price index | 1.7 | 1.8 | 1.7 |
| PCE price index | 1.5 | 1.6 | 1.5 |
| PCE price index excluding food and energy | 1.4 | 1.4 | 1.3 |
Real GDP by Industry
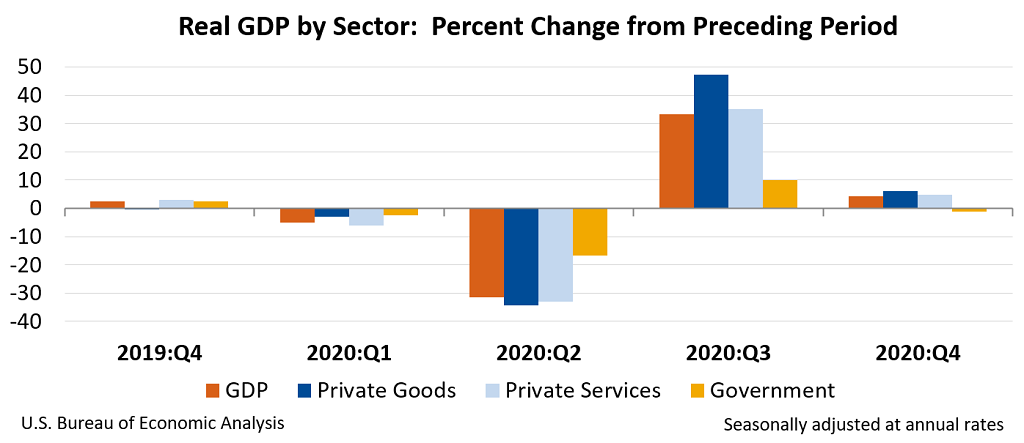
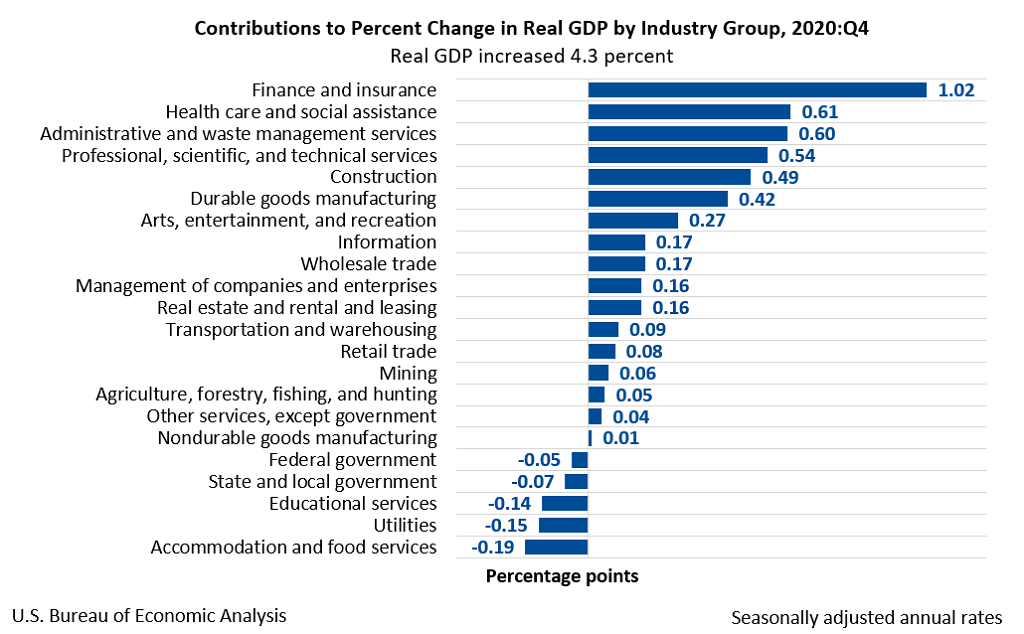
Today's release includes estimates of GDP by industry, or value added—a measure of an industry's contribution to GDP. In the fourth quarter, private goods-producing industries increased 6.1 percent, private services-producing industries increased 4.9 percent, and government decreased 1.1 percent (table 12). Overall, 17 of 22 industry groups contributed to the fourth-quarter increase in real GDP.
The increase in private goods-producing industries reflected increases in construction and in durable goods manufacturing (led by computer and electronic products as well as fabricated metal products).
The increase in private services-producing industries reflected increases in finance and insurance (led by Federal Reserve banks, credit intermediation, and related activities); health care and social assistance (led by ambulatory health care services); administrative and waste management services (led by administrative and support services); and professional, scientific and technical services. These increases were partly offset by decreases in accommodation and food services (led by food services and drinking places); utilities; and educational services.
The decrease in the government sector reflected decreases in state and local government as well as federal government.
Gross Output by Industry
Real gross output—principally a measure of an industry's sales or receipts, which includes sales to final users in the economy (GDP) and sales to other industries (intermediate inputs)—increased 6.7 percent in the fourth quarter. Private goods-producing industries increased 7.2 percent, private services-producing industries increased 7.8 percent, and government was unchanged (table 16). Overall, 17 of 22 industry groups contributed to the increase in real gross output, led by durable goods manufacturing; professional, scientific, and technical services; and health care and social assistance. Industries with notable decreases in gross output included educational services, utilities, and accommodation and food services.
GDP for 2020
Real GDP decreased 3.5 percent in 2020 (from the 2019 annual level to the 2020 annual level), compared with an increase of 2.2 percent in 2019 (table 1).
The decrease in real GDP in 2020 reflected decreases in PCE, exports, private inventory investment, nonresidential fixed investment, and state and local government that were partly offset by increases in federal government spending and residential fixed investment. Imports decreased (table 2).
The decrease in PCE in 2020 was more than accounted for by a decrease in services (led by food services and accommodations, health care, and recreation services). The decrease in exports reflected decreases in both services (led by travel) and goods (mainly non-automotive capital goods). The decrease in private inventory investment reflected widespread decreases led by retail trade (mainly motor vehicle dealers) and wholesale trade (mainly durable goods industries). The decrease in nonresidential fixed investment reflected decreases in structures (led by mining exploration, shafts, and wells) and equipment (led by transportation equipment) that were partly offset by an increase in intellectual property products (more than accounted for by software). The decrease in state and local government spending reflected a decrease in consumption expenditures (led by compensation).
The increase in federal government spending in 2020 reflected an increase in nondefense consumption expenditures (led by an increase in purchases of intermediate services that supported the processing and administration of Paycheck Protection Program loan applications by banks on behalf of the federal government). The increase in residential fixed investment primarily reflected increases in improvements as well as brokers' commissions and other ownership transfer costs.
Current-dollar GDP decreased 2.3 percent, or $496.6 billion, in 2020 to a level of $20.94 trillion, compared with an increase of 4.0 percent, or $821.3 billion, in 2019 (tables 1 and 3).
The price index for gross domestic purchases increased 1.2 percent in 2020, compared with an increase of 1.6 percent in 2019 (table 4). The PCE price index also increased 1.2 percent in 2020, compared with an increase of 1.5 percent. Excluding food and energy prices, the PCE price index increased 1.4 percent, compared with an increase of 1.7 percent.
Measured from the fourth quarter of 2019 to the fourth quarter of 2020, real GDP decreased 2.4 percent during 2020 (table 6). That compared with an increase of 2.3 percent during 2019.
The price index for gross domestic purchases, as measured from the fourth quarter of 2019 to the fourth quarter of 2020, increased 1.2 percent during 2020. That compared with an increase of 1.4 percent during 2019. The PCE price index increased 1.2 percent, compared with an increase of 1.5 percent. Excluding food and energy, the PCE price index increased 1.4 percent, compared with an increase of 1.6 percent.
Gross Domestic Income and Corporate Profits for 2020
Real GDI decreased 3.5 percent in 2020, compared with an increase of 1.8 percent in 2019 (table 1). The average of real GDP and real GDI decreased 3.5 percent in 2020, compared with an increase of 2.0 percent in 2019.
In 2020, profits from current production decreased $130.2 billion, in contrast to an increase of $7.6 billion in 2019 (table 10). Profits of domestic financial corporations decreased $0.5 billion, in contrast to an increase of $38.0 billion. Profits of domestic nonfinancial corporations decreased $55.7 billion, compared with a decrease of $23.3 billion. Rest-of-the-world profits decreased $74.0 billion, compared with a decrease of $7.1 billion. In 2020, receipts decreased $117.8 billion, and payments decreased $43.8 billion.
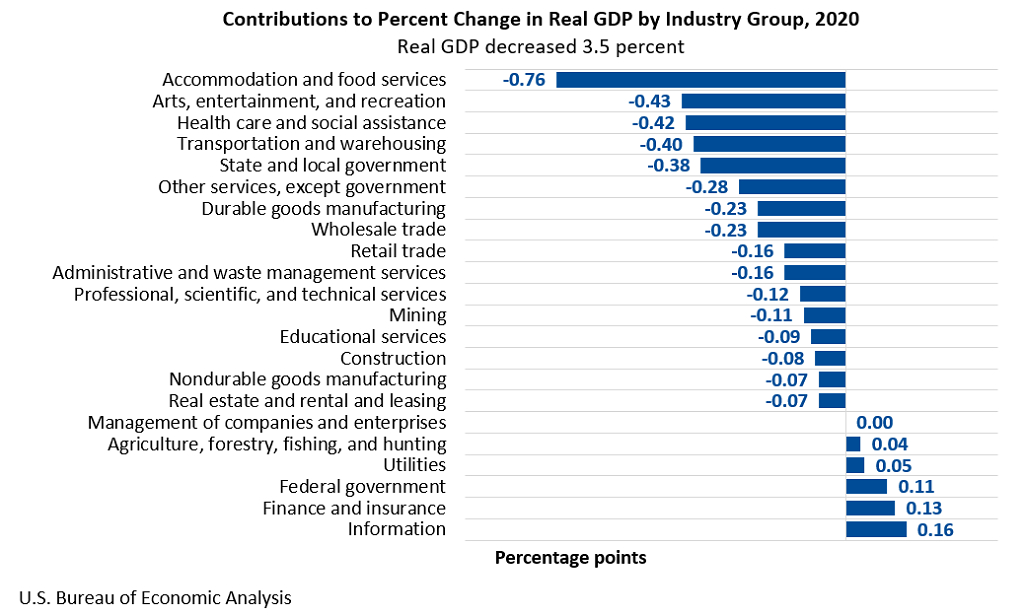
Real GDP by Industry for 2020
In 2020, private goods-producing industries decreased 2.7 percent, private services-producing industries decreased 3.9 percent, and government decreased 2.1 percent (table 12). Overall, 16 of 22 industry groups contributed to the decrease in real GDP in 2020 (table 13).
Within private goods-producing industries, the leading contributors to the decrease were durable goods manufacturing (led by other transportation equipment) and mining.
Decreases within the private services-producing industries were widespread; the leading contributors to the decrease were accommodation and food services (led by food services and drinking places); arts, entertainment, and recreation; health care and social assistance (led by ambulatory health care services); and transportation and warehousing. Partly offsetting these decreases were increases in information (mainly data processing, internet publishing, and other information services) and in finance and insurance (mainly Federal Reserve banks, credit intermediation, and related activities).
The decrease in government reflected a decrease in state and local government that was partly offset by an increase in federal government.
Real gross output in 2020 decreased 3.3 percent. Private goods-producing industries decreased 2.7 percent, private services-producing industries decreased 3.9 percent, and government decreased 0.7 percent (table 16). Overall, 16 of 22 industry groups contributed to the decrease in real gross output.
* * *
Next release, April 29, 2021 at 8:30 A.M. EDT
Gross Domestic Product, First Quarter 2021
* * *