
News Release
Outdoor Recreation Satellite Account, U.S. and States, 2020
New statistics for 2020; prior years updated
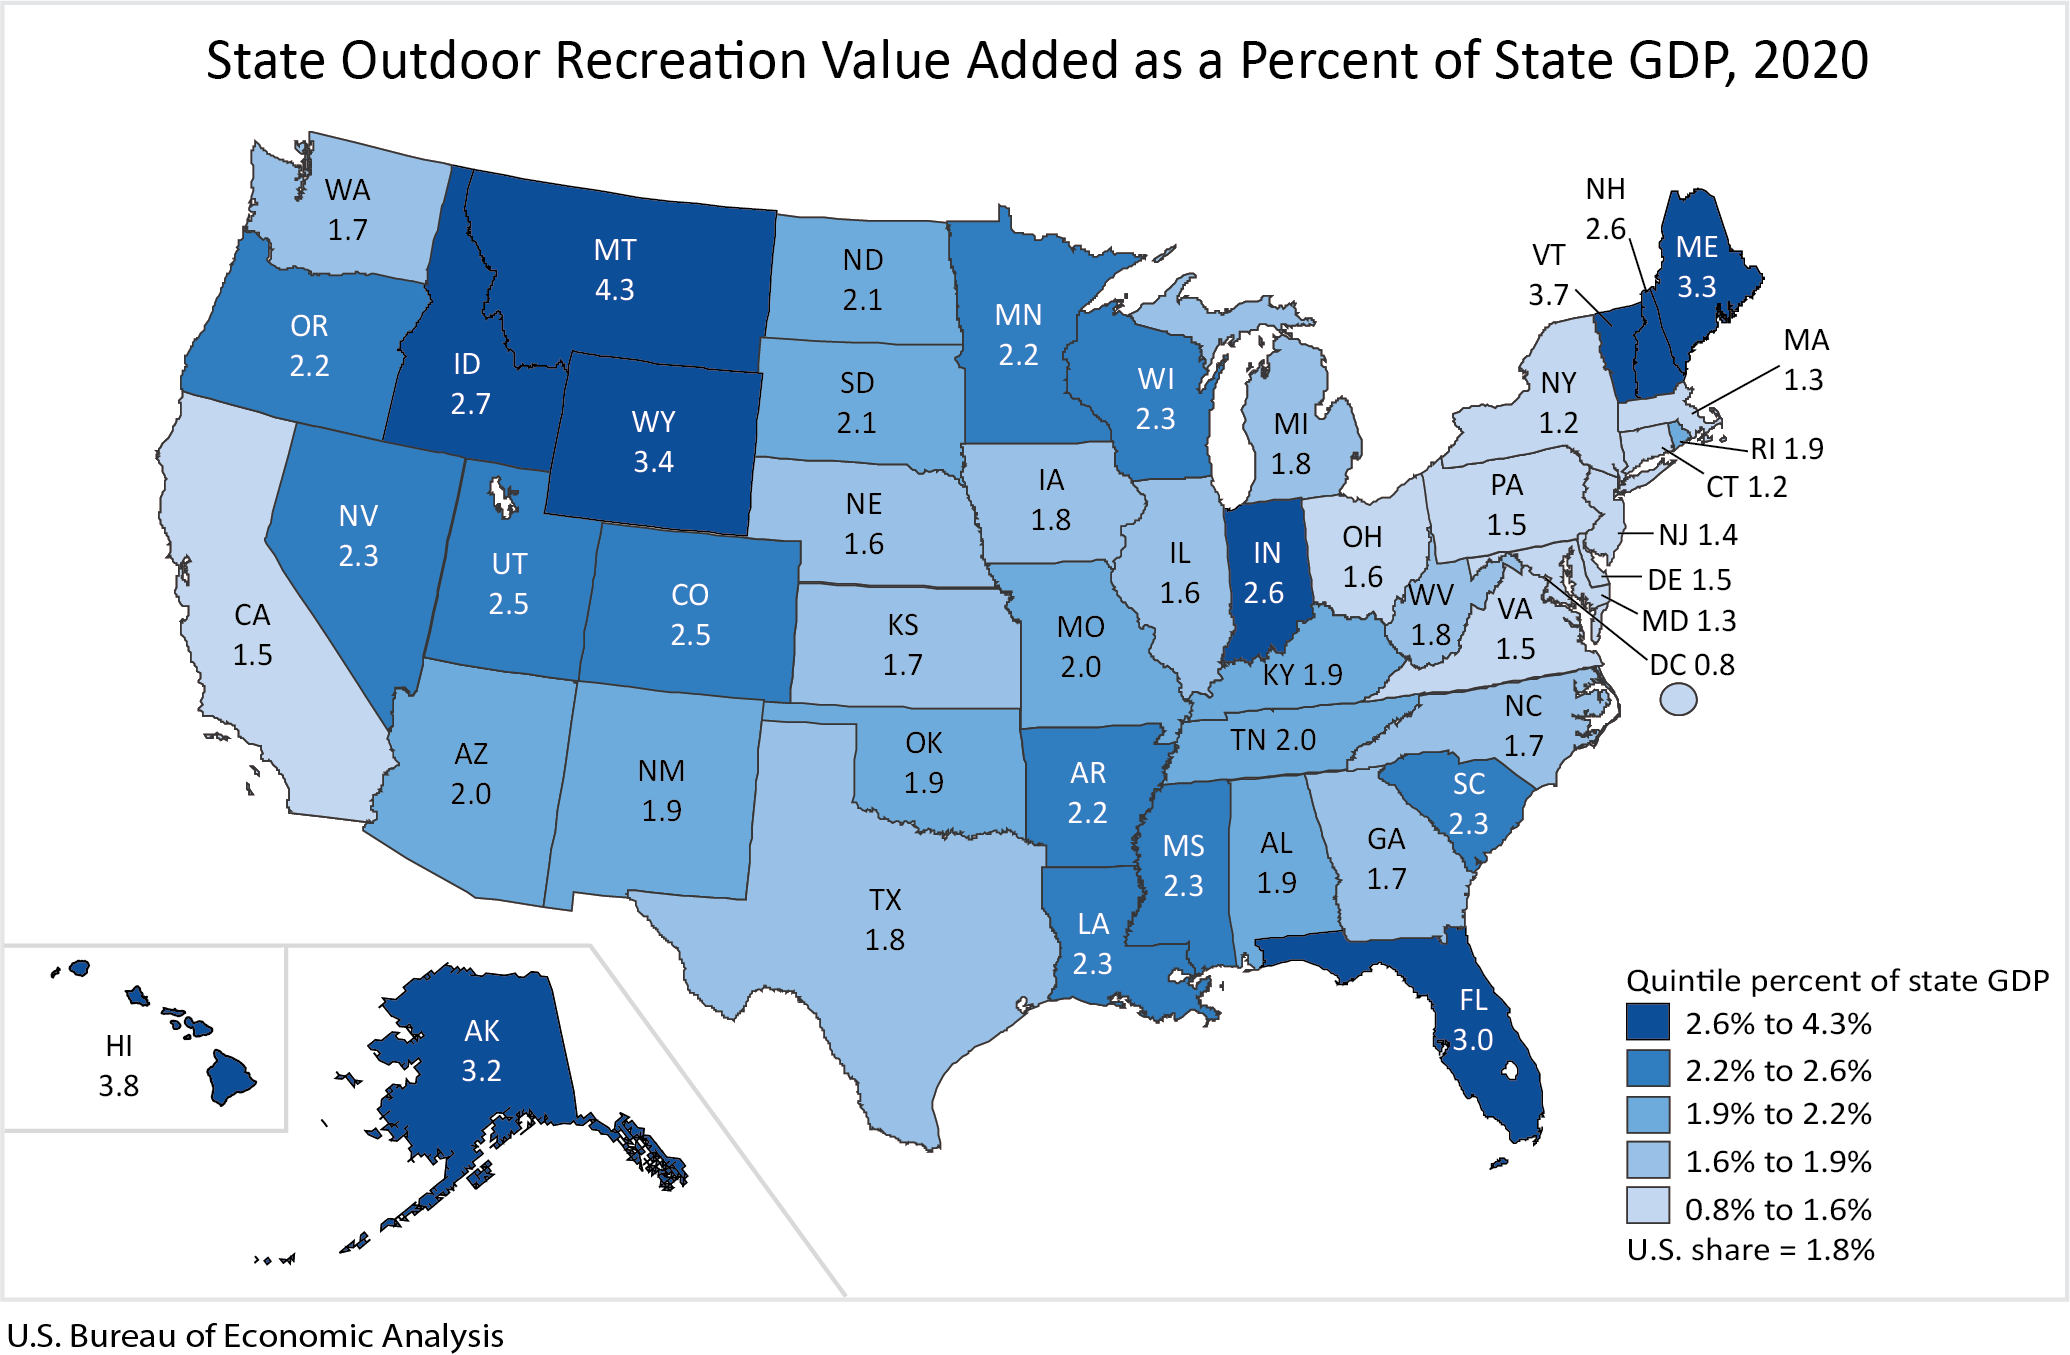
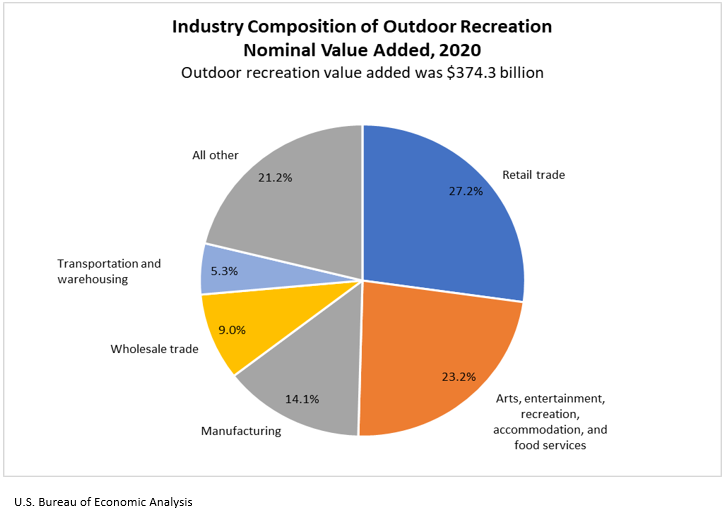
The U.S. Bureau of Economic Analysis (BEA) released statistics today measuring the outdoor recreation economy for the nation, all 50 states, and the District of Columbia. The new U.S. data show that the outdoor recreation economy accounted for 1.8 percent ($374.3 billion) of current-dollar gross domestic product (GDP) for the nation in 2020 (national table 3). At the state level, outdoor recreation value added as a share of state GDP ranged from 4.3 percent in Montana to 1.2 percent in New York and Connecticut. The share was 0.8 percent in the District of Columbia.
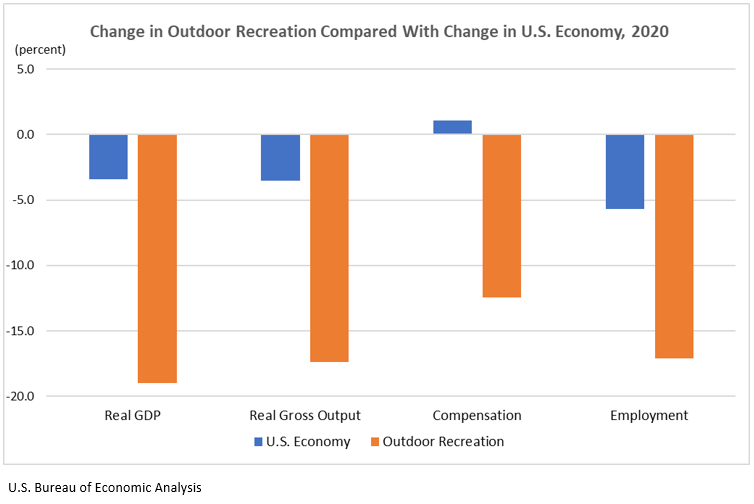
Inflation-adjusted (real) GDP for the outdoor recreation economy decreased 19.0 percent from 2019 to 2020, compared with a 3.4 percent decrease for the overall U.S. economy. Real gross output for the outdoor recreation economy decreased 17.4 percent, while outdoor recreation compensation decreased 12.5 percent and employment decreased 17.1 percent.
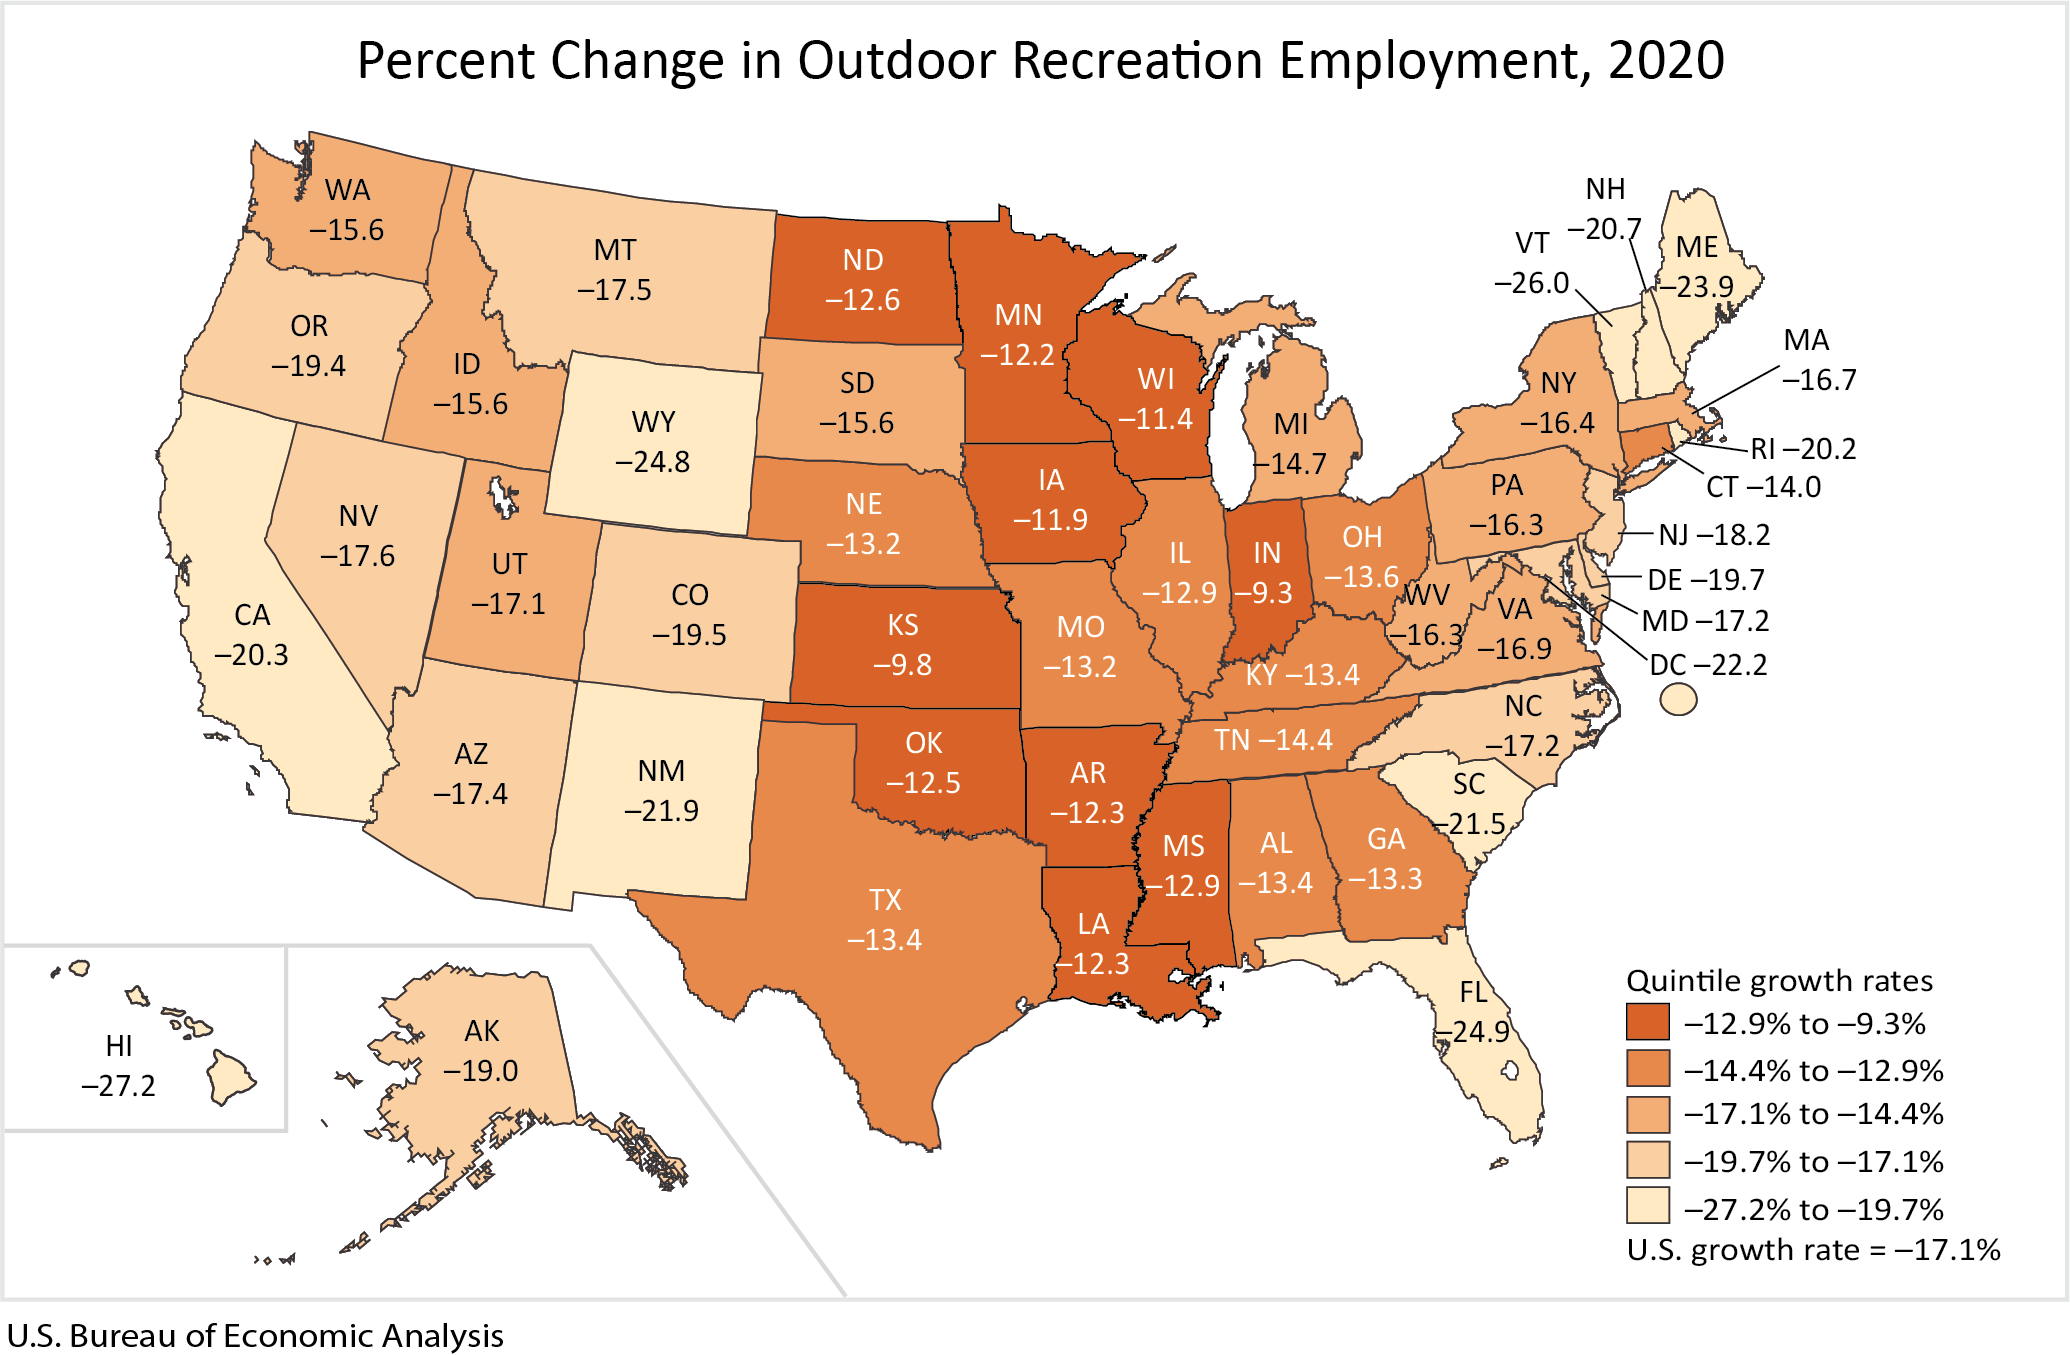
Across all 50 states and the District of Columbia, outdoor recreation employment decreased in 2020, ranging from –9.3 percent in Indiana to –27.2 percent in Hawaii.
Outdoor recreation by activity
Outdoor recreation activities fall into three general categories: conventional activities (such as bicycling, boating, hiking, and hunting); other core activities (such as gardening and outdoor concerts); and supporting activities (such as construction, travel and tourism, local trips, and government expenditures).
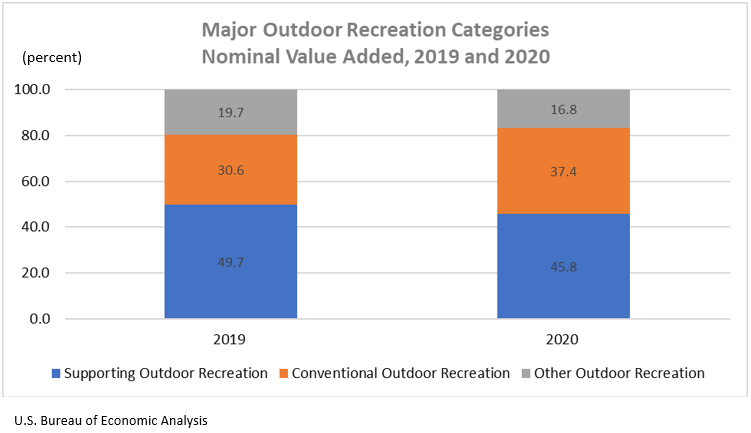
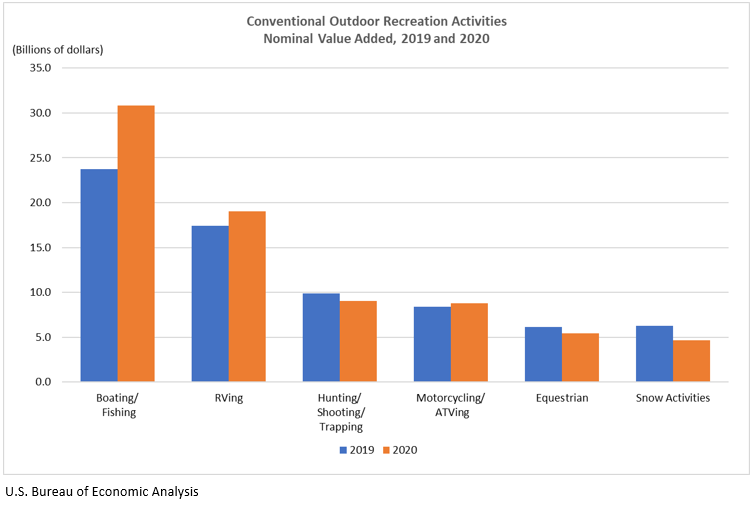
In 2020, conventional outdoor recreation accounted for 37.4 percent of U.S. outdoor recreation value added, compared with 30.6 percent in 2019. The increase was due to higher spending on boating/fishing and RVing. Other outdoor recreation accounted for 16.8 percent of value added in 2020, compared with 19.7 percent in 2019. The decrease was driven by amusement parks/water parks and festivals/sporting events/concerts. Supporting activities accounted for the remaining 45.8 percent of value added in 2020, compared with 49.7 percent in 2019. Supporting activities, particularly travel and tourism-related activities, declined in 2020 during the COVID-19 pandemic as consumers traveled less and reduced spending at hotels and restaurants.
Additional value added by activity highlights for 2020 include:
- Boating/fishing was the largest conventional activity for the nation as a whole at $30.8 billion in current-dollar value added and was the largest conventional activity in 39 states and the District of Columbia. Florida ($3.8 billion), California ($2.8 billion), and Texas ($2.8 billion) were the largest contributors to U.S. value added for the activity (state table 2).
- RVing was the second-largest conventional activity nationally at $19.1 billion in current-dollar value added and was the largest conventional activity in five states. The largest contributors were Indiana ($3.4 billion) and Texas ($1.7 billion).
- Snow activities was the largest conventional activity in Colorado ($1.2 billion), Utah ($468.0 million), Vermont ($191.3 million), and Wyoming ($92.2 million) in current-dollar value added. At the national level, current-dollar value added for snow activities was $4.7 billion.
Outdoor recreation by industry
The outdoor recreation by industry data show the contribution of different industries to the outdoor recreation economy, including their impact on value added, gross output, employment, and compensation.
For the nation, the retail trade sector was the largest contributor to U.S. outdoor recreation value added in 2020, accounting for $101.9 billion (national table 6). At the state level, retail trade was the largest contributor to outdoor recreation value added in 35 states. The leading contributors were California ($11.6 billion), Florida ($8.8 billion), and Texas ($8.6 billion) (state table 3).
Additional value added by industry highlights for 2020 include:
- Arts, entertainment, recreation, accommodation, and food services, the second-largest sector, contributed $86.8 billion in current-dollar value added to outdoor recreation nationally. At the state level, this industry was the largest contributor to outdoor recreation in 13 states and the District of Columbia.
- Manufacturing, the third-largest sector, contributed $52.8 billion nationally to the outdoor recreation economy. At the state level, this sector was the largest contributor to the outdoor recreation economy in Indiana ($5.3 billion) and Wisconsin ($1.9 billion).
Outdoor Recreation Satellite Account, U.S. and States, 2021