
Bureau of Economic Analysis
U.S. International Investment Position, 3rd Quarter 2025
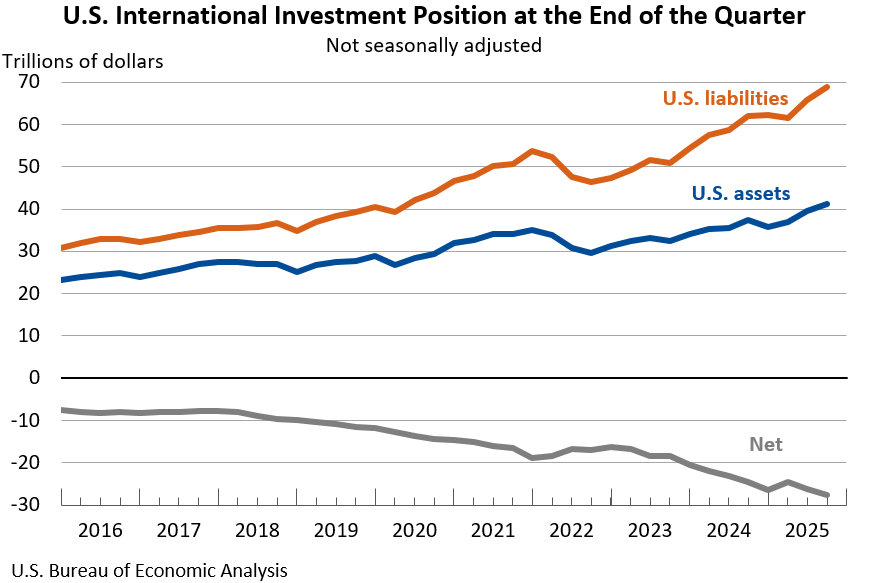
The U.S. net international investment position, the difference between U.S. residents’ foreign financial assets and liabilities, was -$27.61 trillion at the end of the third quarter of 2025, according to statistics released today by the U.S. Bureau of Economic Analysis. Assets totaled $41.27 trillion, and liabilities were $68.89 trillion. At the end of the second quarter, the net investment position was -$26.16 trillion (revised).
Principal Federal Economic Indicators
Noteworthy


The Latest
U.S. International Trade in Goods and Services: August 2004
The first two pages of this release are shown in plain text below.
Personal Income, August 2004
The entire release is available in PDF format. The tables in this release are available in an XLS spreadsheet.
Gross Domestic Product and Corporate Profits: Second Quarter 2004 "final" estimates
The tables from this news release are available in XLS format and the entire release is available in PDF format.
State Personal Income: Second Quarter 2004
The tables in this release are available in an XLS spreadsheet and the entire release is available in PDF format.
U.S. International Trade in Goods and Services: July 2004
The first two pages of this release are shown in plain text below.
Tourism Satellite Accounts, Second Quarter 2004
The tables in this release are available in an XLS spreadsheet and the entire release is available in PDF format.
Gross Domestic Product and Corporate Profits: Second Quarter 2004 "preliminary" estimates
The tables from this news release are available in XLS format and the entire release is available in PDF format.
U.S. International Trade in Goods and Services: June 2004
The first two pages of this release are shown in plain text below.
Personal Income, June 2004
The entire release is available in PDF format. The tables in this release are available in an XLS spreadsheet.