
Bureau of Economic Analysis
U.S. International Investment Position, 3rd Quarter 2025
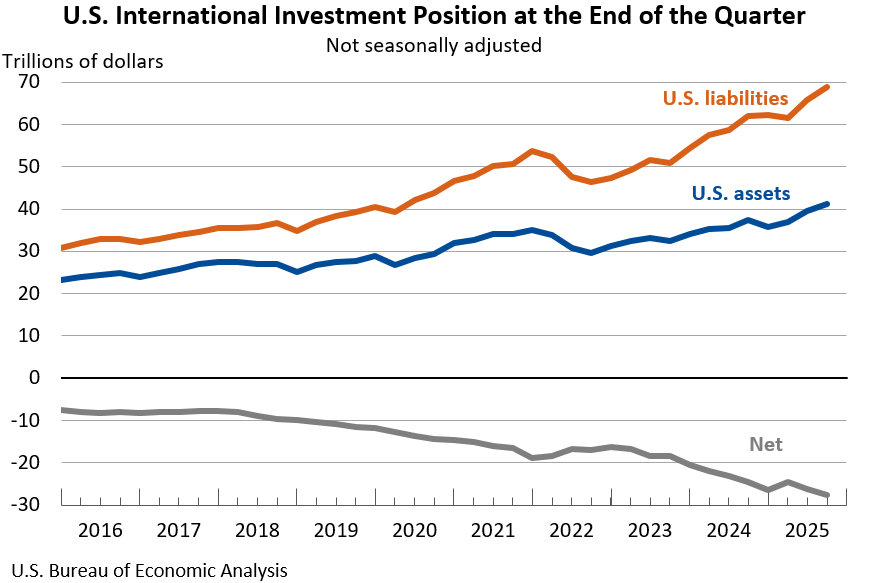
The U.S. net international investment position, the difference between U.S. residents’ foreign financial assets and liabilities, was -$27.61 trillion at the end of the third quarter of 2025, according to statistics released today by the U.S. Bureau of Economic Analysis. Assets totaled $41.27 trillion, and liabilities were $68.89 trillion. At the end of the second quarter, the net investment position was -$26.16 trillion (revised).
Principal Federal Economic Indicators
Noteworthy


The Latest
State Personal Income 2nd quarter 1996
This release is available as a text file download.
Personal Income and Outlays, September 1996
This release is available as a text file download.
Gross Domestic Product, 3rd quarter 1996 (advance)
This release is available as a text file download.
U.S. International Trade in Goods and Services, August 1996
This release is available as a text file download.
Personal Income and Outlays, August 1996
This release is available as a text file download.
Gross Domestic Product, 2nd quarter 1996 (final); Corporate Profits, 2nd quarter 1996 (revised)
This release is available as a text file download.
State Per Capita Personal Income Growth in 1995
This release is available as a text file download.
U.S. International Trade in Goods and Services, July 1996
This release is available as a text file download.
U.S. International Transactions, 2nd quarter 1996
This release is available as a text file download.
Pollution Abatement and Control Spending for 1994
This release is available as a text file download.