
News Release
U.S. Net International Investment Position, Fourth Quarter and Year 2018
Fourth Quarter 2018
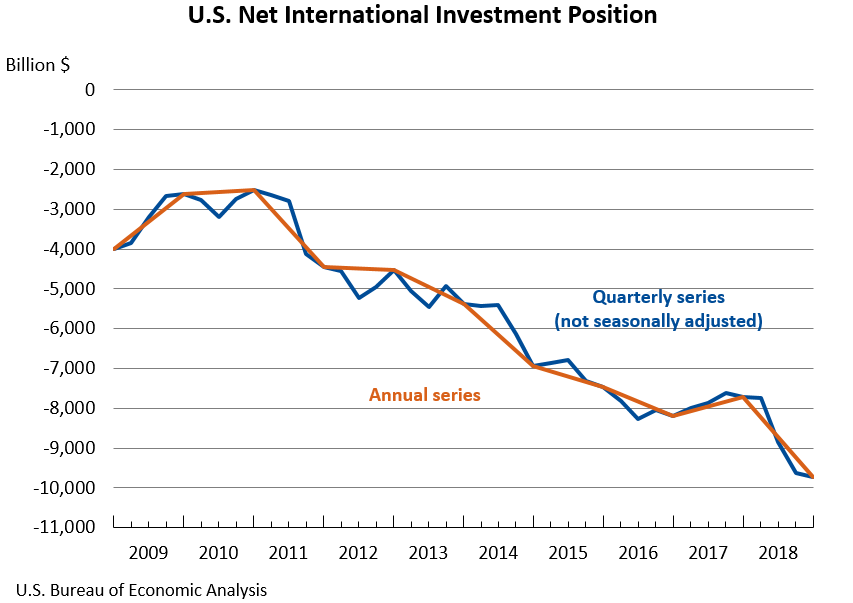
The U.S. net international investment position decreased to −$9,717.1 billion (preliminary) at the end of the fourth quarter of 2018 from −$9,634.8 billion (revised) at the end of the third quarter, according to statistics released by the Bureau of Economic Analysis (BEA). The $82.4 billion decrease reflected a $1,695.4 billion decrease in U.S. assets and a $1,613.0 billion decrease in U.S. liabilities.
The $82.4 billion decrease in the net investment position also reflected net financial transactions of −$199.2 billion and net other changes in position, such as price and exchange-rate changes, of $116.8 billion (table A).
The net investment position decreased 0.9 percent in the fourth quarter, compared with a decrease of 8.9 percent in the third quarter and an average quarterly decrease of 4.7 percent from the first quarter of 2011 through the second quarter of 2018.
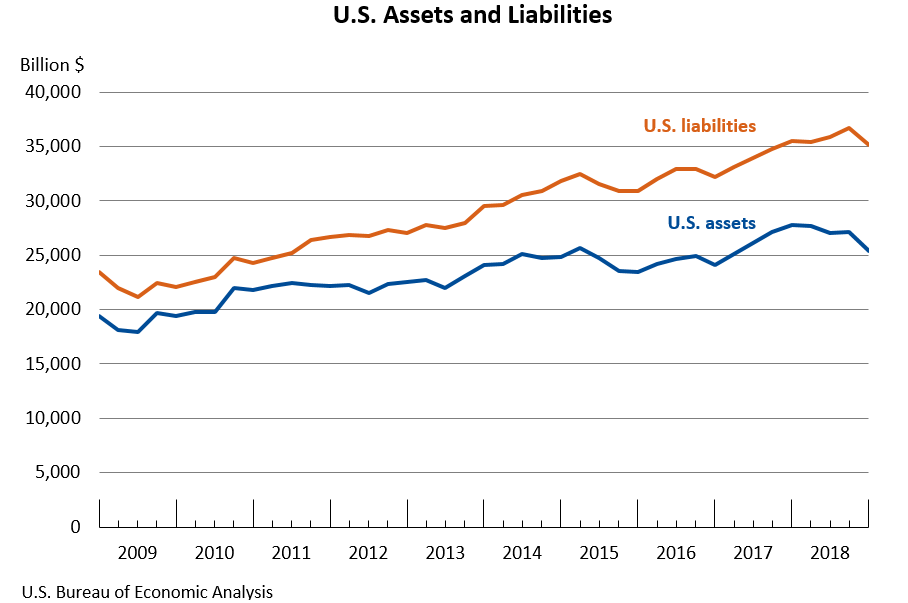
U.S. assets decreased $1,695.4 billion to $25,398.6 billion at the end of the fourth quarter, reflecting decreases in portfolio investment and direct investment assets that were partly offset by increases in financial derivatives, other investment, and reserve assets.
- Assets excluding financial derivatives decreased $1,942.1 billion to $23,652.6 billion. The decrease resulted from financial transactions of $136.5 billion and other changes in position of −$2,078.6 billion (table A).
- Financial transactions reflected net U.S. acquisition of other investment deposit and loan assets and of direct investment equity assets that were partly offset by net U.S. sales of foreign securities.
- Other changes in position were driven by foreign stock price decreases that lowered the equity value of portfolio investment and direct investment assets.
- Financial derivatives increased $246.7 billion to $1,746.0 billion, reflecting increases in single-currency interest rate contracts.
Table A. Quarterly Change in the U.S. Net International Investment Position
Billions of dollars, not seasonally adjusted
| Position, 2018:III |
Change in position in 2018:IV | Position, 2018:IV |
|||
| Total | Attributable to: | ||||
| Financial transactions |
Other changes in position 1 |
||||
| U.S. net international investment position | -9,634.8 | -82.4 | -199.2 | 116.8 | -9,717.1 |
| Net position excluding financial derivatives | -9,692.0 | -56.0 | -179.1 | 123.2 | -9,747.9 |
| Financial derivatives other than reserves, net | 57.2 | -26.4 | -20.1 | -6.3 | 30.8 |
| U.S. assets | 27,094.0 | -1,695.4 | (2) | (2) | 25,398.6 |
| Assets excluding financial derivatives | 25,594.7 | -1,942.1 | 136.5 | -2,078.6 | 23,652.6 |
| Financial derivatives other than reserves | 1,499.2 | 246.7 | (2) | (2) | 1,746.0 |
| U.S. liabilities | 36,728.7 | -1,613.0 | (2) | (2) | 35,115.7 |
| Liabilities excluding financial derivatives | 35,286.7 | -1,886.2 | 315.6 | -2,201.8 | 33,400.5 |
| Financial derivatives other than reserves | 1,442.0 | 273.1 | (2) | (2) | 1,715.2 |
| 1. Disaggregation of other changes in position into price changes, exchange-rate changes, and other changes in volume and valuation is only presented for annual statistics released in June each year. 2. Financial transactions and other changes in financial derivatives positions are available only on a net basis; they are not separately available for U.S. assets and U.S. liabilities. |
|||||
U.S. liabilities decreased $1,613.0 billion to $35,115.7 billion at the end of the fourth quarter, reflecting decreases in portfolio investment and direct investment liabilities that were partly offset by increases in other investment liabilities and financial derivatives.
- Liabilities excluding financial derivatives decreased $1,886.2 billion to $33,400.5 billion. The decrease resulted from financial transactions of $315.6 billion and other changes in position of −$2,201.8 billion (table A).
- Financial transactions reflected net U.S. incurrence of other investment loan and deposit liabilities and of direct investment equity liabilities that were partly offset by net foreign sales of U.S. securities, especially of U.S. long-term debt.
- Other changes in position were driven by U.S. stock price decreases that lowered the equity value of portfolio investment and direct investment liabilities.
- Financial derivatives increased $273.1 billion to $1,715.2 billion, reflecting increases in single-currency interest rate contracts.
Updates to Statistics
Table B. Updates to Third-Quarter 2018 International Investment Position Aggregates
Billions of dollars, not seasonally adjusted
| Preliminary estimate | Revised estimate | |
|---|---|---|
| U.S. net international investment position | -9,627.2 | -9,634.8 |
| U.S. assets | 27,150.7 | 27,094.0 |
| Direct investment at market value | 8,468.6 | 8,451.3 |
| Portfolio investment | 12,558.8 | 12,543.2 |
| Financial derivatives other than reserves | 1,499.2 | 1,499.2 |
| Other investment | 4,201.1 | 4,177.2 |
| Reserve assets | 423.0 | 423.0 |
| U.S. liabilities | 36,777.9 | 36,728.7 |
| Direct investment at market value | 9,591.1 | 9,583.2 |
| Portfolio investment | 19,882.9 | 19,882.9 |
| Financial derivatives other than reserves | 1,442.0 | 1,442.0 |
| Other investment | 5,861.9 | 5,820.6 |
Year 2018
The U.S. net international investment position decreased to −$9,717.1 billion (preliminary) at the end of 2018 from −$7,725.0 billion at the end of 2017. The $1,992.1 billion decrease reflected a $2,400.5 billion decrease in U.S. assets and a $408.4 billion decrease in U.S. liabilities. The decrease in the net investment position also reflected net financial transactions of −$519.6 billion and net other changes in position, such as price and exchange-rate changes, of −$1,472.6 billion (table C).
U.S. assets decreased $2,400.5 billion to $25,398.6 billion at the end of 2018, reflecting decreases in direct investment and portfolio investment assets that were partly offset by increases in financial derivatives and other investment assets.
- Assets excluding financial derivatives decreased $2,524.0 billion to $23,652.6 billion. The decrease resulted from financial transactions of $301.6 billion and other changes in position of −$2,825.6 billion (table C).
- Financial transactions reflected net U.S. purchases of foreign securities and net U.S. acquisition of other investment deposit assets that were partly offset by net U.S. withdrawal of direct investment equity assets. The net withdrawal of direct investment equity assets reflected U.S. parent repatriation of previously reinvested earnings in response to the Tax Cuts and Jobs Act. For more information, see the box "Effects of the 2017 Tax Cuts and Jobs Act on U.S. Direct Investment Assets."
- Other changes in position mostly reflected foreign stock price decreases that lowered the equity value of portfolio investment and direct investment assets, and to a lesser extent, the depreciation of major foreign currencies against the U.S. dollar that lowered the value of foreign-currency-denominated assets in dollar terms.
- Financial derivatives increased $123.5 billion to $1,746.0 billion, mostly in single-currency interest rate contracts and foreign exchange contracts.
Table C. Annual Change in the U.S. Net International Investment Position
Billions of dollars
| Position, 2017 |
Change in position in 2018 | Position, 2018 |
|||
| Total | Attributable to: | ||||
| Financial transactions |
Other changes in position 1 |
||||
| U.S. net international investment position | -7,725.0 | -1,992.1 | -519.6 | -1,472.6 | -9,717.1 |
| Net position excluding financial derivatives | -7,753.3 | -1,994.7 | -499.3 | -1,495.4 | -9,747.9 |
| Financial derivatives other than reserves, net | 28.3 | 2.5 | -20.3 | 22.8 | 30.8 |
| U.S. assets | 27,799.1 | -2,400.5 | (2) | (2) | 25,398.6 |
| Assets excluding financial derivatives | 26,176.6 | -2,524.0 | 301.6 | -2,825.6 | 23,652.6 |
| Financial derivatives other than reserves | 1,622.5 | 123.5 | (2) | (2) | 1,746.0 |
| U.S. liabilities | 35,524.1 | -408.4 | (2) | (2) | 35,115.7 |
| Liabilities excluding financial derivatives | 33,929.8 | -529.3 | 800.9 | -1,330.2 | 33,400.5 |
| Financial derivatives other than reserves | 1,594.2 | 120.9 | (2) | (2) | 1,715.2 |
| 1. Disaggregation of other changes in position into price changes, exchange-rate changes, and other changes in volume and valuation is only presented for annual statistics released in June each year. 2. Financial transactions and other changes in financial derivatives positions are available only on a net basis; they are not separately available for U.S. assets and U.S. liabilities. |
|||||
U.S. liabilities decreased $408.4 billion to $35,115.7 billion at the end of 2018, reflecting decreases in portfolio investment and direct investment liabilities that were partly offset by increases in other investment liabilities and financial derivatives.
- Liabilities excluding financial derivatives decreased $529.3 billion to $33,400.5 billion. The decrease resulted from financial transactions of $800.9 billion and other changes in position of −$1,330.2 billion (table C).
- Financial transactions reflected net incurrence of liabilities in all major investment categories.
- Other changes in position mostly reflected U.S. stock price decreases that lowered the equity value of portfolio investment and direct investment liabilities.
- Financial derivatives increased $120.9 billion to $1,715.2 billion, mostly in single-currency interest rate contracts and foreign exchange contracts.
Effects of the 2017 Tax Cuts and Jobs Act on U.S. Direct Investment Assets
The earnings of foreign affiliates of U.S. multinational enterprises consist of repatriated earnings to the parent company in the United States in the form of dividends and reinvested earnings in foreign affiliates. When dividends exceed earnings in a given period, reinvested earnings (calculated as a residual) are negative, indicating a withdrawal of equity assets. In 2018, the $58.5 billion net withdrawal of direct investment equity assets reflected reinvested earnings of −$141.6 billion and net U.S. acquisition of equity other than reinvested earnings of $83.1 billion. The net withdrawal of direct investment equity assets in 2018 reflected the repatriation of accumulated prior earnings of foreign affiliates by their U.S. parent companies as dividends, in response to the 2017 Tax Cuts and Jobs Act (TCJA), which generally eliminated taxes on repatriated earnings.
The financial transactions highlighted in this release and related income transactions are reflected in the U.S. international transactions accounts. For more information about how the TCJA affected direct investment asset and income transactions, see "U.S. International Transactions: Fourth Quarter and Year 2018," which was released on March 27, 2019, and two BEA FAQs "How are the international transactions accounts affected by an increase in direct investment dividend receipts?" and "How does the 2017 Tax Cuts and Jobs Act affect BEA's business income statistics?"Notice of Upcoming Update to the U.S. Net International Investment Position
The annual update of the U.S. net international investment position will be released along with preliminary estimates for the first quarter of 2019 on June 26, 2019. A preview of the annual update will appear in the April 2019 issue of the Survey of Current Business.
Next release: June 26, 2019, at 8:30 A.M. EDT
U.S. Net International Investment Position, First Quarter 2019, Year 2018, and Annual Update
* * *
U.S. Net International Investment Position Release Dates in 2019
| Fourth Quarter and Year 2018 | March 29 |
| First Quarter 2019, Year 2018, and Annual Update | June 26 |
| Second Quarter 2019 | September 30 |
| Third Quarter 2019 | December 27 |