
News Release
Gross Domestic Product (Third Estimate), Corporate Profits (Revised Estimate), and GDP by Industry, Third Quarter 2021
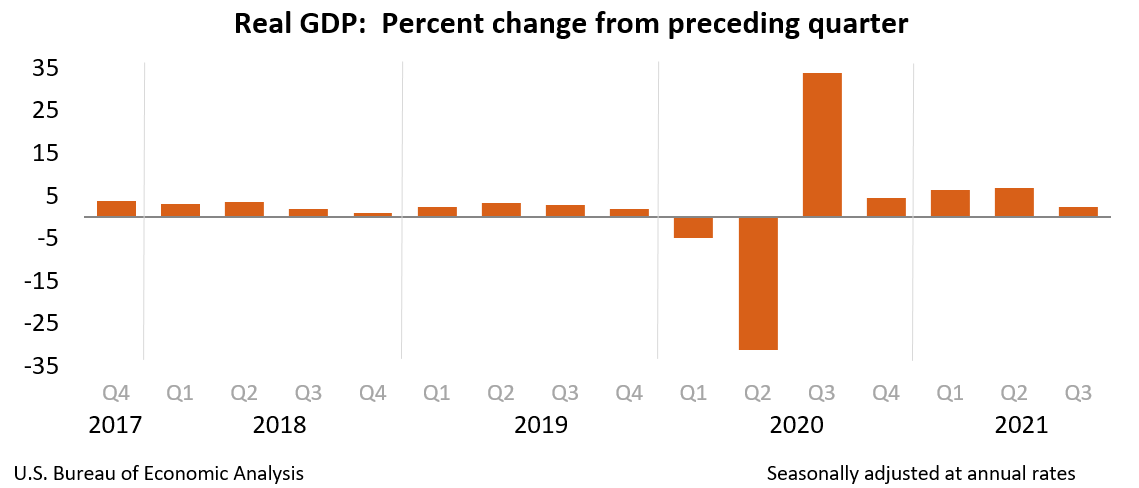
Real gross domestic product (GDP) increased at an annual rate of 2.3 percent in the third quarter of 2021 (table 1), according to the "third" estimate released by the Bureau of Economic Analysis. In the second quarter, real GDP increased 6.7 percent.
The “third” estimate of GDP released today is based on more complete source data than were available for the "second" estimate issued last month. In the second estimate, the increase in real GDP was 2.1 percent. The update primarily reflects upward revisions to personal consumption expenditures (PCE) and private inventory investment that were partly offset by a downward revision to exports. Imports, which are a subtraction in the calculation of GDP, were revised down (refer to "Updates to GDP").
The increase in real GDP in the third quarter reflected increases in private inventory investment, PCE, state and local government spending, and nonresidential fixed investment that were partly offset by decreases in exports, residential fixed investment, and federal government spending. Imports increased (table 2).
The increase in private inventory investment reflected increases in wholesale trade (led by nondurable goods industries) and in retail trade (led by motor vehicles and parts dealers). The increase in PCE reflected an increase in services that was partly offset by a decrease in goods. Within services, increases were widespread with the largest contributions coming from “other” services (mainly international travel) and transportation services. The decrease in goods primarily reflected a decrease in spending on motor vehicles and parts. The increase in state and local government spending was led by employee compensation (notably, education). The increase in nonresidential fixed investment reflected an increase in intellectual property products (led by software and research and development) that was partly offset by decreases in equipment and structures.
The decrease in residential fixed investment primarily reflected decreases in improvements and in new single-family structures. The decrease in federal government spending primarily reflected a decrease in nondefense spending on intermediate goods and services after the processing and administration of Paycheck Protection Program loan applications by banks on behalf of the federal government ended in the second quarter. The decrease in exports reflected decreases in both goods and services. The increase in imports primarily reflected an increase in services (led by travel and transport).
The deceleration in real GDP in the third quarter was more than accounted for by a slowdown in PCE. From the second quarter to the third quarter, spending for goods turned down (led by motor vehicles and parts) and services decelerated (led by food services and accommodations).
Current dollar GDP increased 8.4 percent at an annual rate, or $461.3 billion, in the third quarter to a level of $23.20 trillion. In the second quarter, GDP increased 13.4 percent, or $702.8 billion (table 1 and table 3). More information on the source data that underlie the estimates is available in the "Key Source Data and Assumptions" file on BEA’s website.
The price index for gross domestic purchases increased 5.6 percent in the third quarter, compared with an increase of 5.8 percent in the second quarter (table 4). The PCE price index increased 5.3 percent, compared with an increase of 6.5 percent. Excluding food and energy prices, the PCE price index increased 4.6 percent, compared with an increase of 6.1 percent.
Gross Domestic Income and Corporate Profits
Real gross domestic income (GDI) increased 5.8 percent in the third quarter, compared with an increase of 4.3 percent in the second quarter. The average of real GDP and real GDI, a supplemental measure of U.S. economic activity that equally weights GDP and GDI, increased 4.1 percent in the third quarter, compared with an increase of 5.5 percent in the second quarter (table 1).
Profits from current production (corporate profits with inventory valuation and capital consumption adjustments) increased $96.9 billion in the third quarter, compared with an increase of $267.8 billion in the second quarter (table 10).
Profits of domestic financial corporations increased $14.2 billion in the third quarter, compared with an increase of $52.8 billion in the second quarter. Profits of domestic nonfinancial corporations increased $31.6 billion, compared with an increase of $221.3 billion. Rest-of-the-world profits increased $51.1 billion, in contrast to a decrease of $6.2 billion. In the third quarter, receipts increased $65.2 billion, and payments increased $14.1 billion.
Updates to GDP
In the third estimate of the third quarter, real GDP increased 2.3 percent, 0.2 percentage point higher than in the second estimate. Upward revisions to PCE (specifically, an upward revision to services), private inventory investment (both farm and nonfarm), residential fixed investment, state and local government spending, and nonresidential fixed investment were partly offset by downward revisions to exports and federal government spending. Imports were revised down. For more information, refer to the Technical Note and the "Additional Information" section that follows.
| Advance Estimate | Second Estimate | Third Estimate | |
|---|---|---|---|
| (Percent change from preceding quarter) | |||
| Real GDP | 2.0 | 2.1 | 2.3 |
| Current-dollar GDP | 7.8 | 8.1 | 8.4 |
| Real GDI | … | 6.7 | 5.8 |
| Average of Real GDP and Real GDI | … | 4.4 | 4.1 |
| Gross domestic purchases price index | 5.4 | 5.5 | 5.6 |
| PCE price index | 5.3 | 5.3 | 5.3 |
| PCE price index excluding food and energy | 4.5 | 4.5 | 4.6 |
Real GDP by Industry
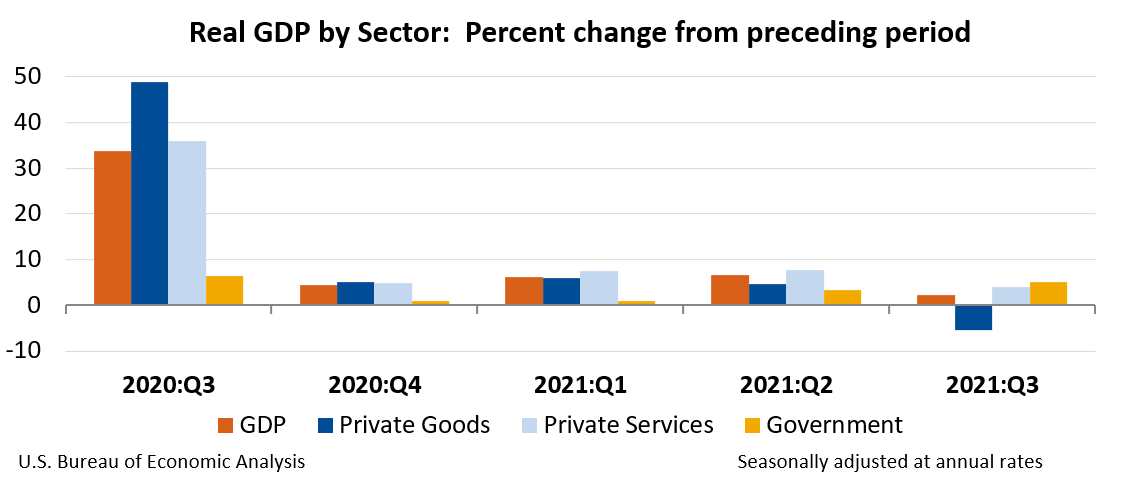
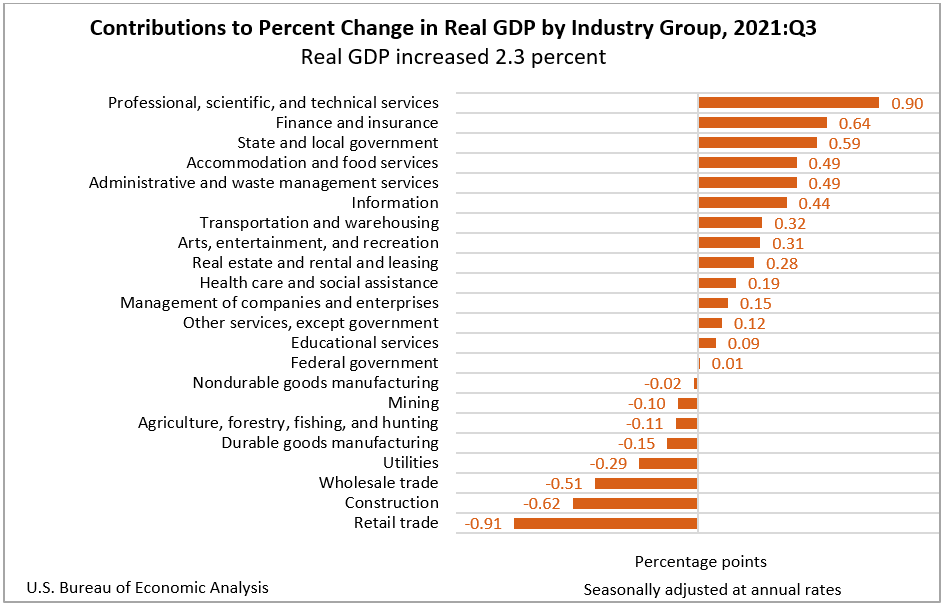
Today’s release includes estimates of GDP by industry, or value added—a measure of an industry’s contribution to GDP. In the third quarter, private services-producing industries increased 3.9 percent, government increased 5.1 percent, and private goods-producing industries decreased 5.5 percent (table 12). Overall, 14 of 22 industry groups contributed to the third-quarter increase in real GDP.
The increase in private services-producing industries primarily reflected increases in professional, scientific, and technical services; finance and insurance (led by securities, commodity contracts, and investments); accommodation and food services; administrative and waste management services (led by administrative and support services); and information (led by motion picture and sound recording industries). These increases were partly offset by decreases in retail trade (led by motor vehicle and parts dealers) and wholesale trade.
The decrease in private goods-producing industries was widespread, led by construction.
The increase in government primarily reflected an increase in state and local government.
Gross Output by Industry
Real gross output—principally a measure of an industry’s sales or receipts, adjusted for price change, which includes sales to final users in the economy (GDP) and sales to other industries (intermediate inputs)—increased 4.4 percent in the third quarter. Private services-producing industries increased 7.6 percent, government increased 0.3 percent, and private goods-producing industries decreased 2.5 percent (table 16). Overall, 14 of 22 industry groups contributed to the increase in real gross output.
* * *
Next release, January 27, 2022 at 8:30 A.M. EST
Gross Domestic Product, Fourth Quarter 2021 (Advance Estimate) and Year 2021
* * *
| Release Dates in 2022 | ||||
|---|---|---|---|---|
| Estimate | 2021 Q4 and Year 2021 |
2022 Q1 | 2022 Q2 | 2022 Q3 |
| Gross Domestic Product | ||||
| Advance Estimate | January 27, 2022 | April 28, 2022 | July 28, 2022 | October 27, 2022 |
| Second Estimate | February 24, 2022 | May 26, 2022 | August 25, 2022 | November 30, 2022 |
| Third Estimate | March 30, 2022 | June 29, 2022 | September 29, 2022 | December 22, 2022 |
|
Gross Domestic Product by Industry |
March 30, 2022 | June 29, 2022 | September 29, 2022 | December 22, 2022 |
| Corporate Profits | ||||
| Preliminary Estimate | --- | May 26, 2022 | August 25, 2022 | November 30, 2022 |
| Revised Estimate | March 30, 2022 | June 29, 2022 | September 29, 2022 | December 22, 2022 |