
News Release
U.S. International Trade in Goods and Services, December 2020
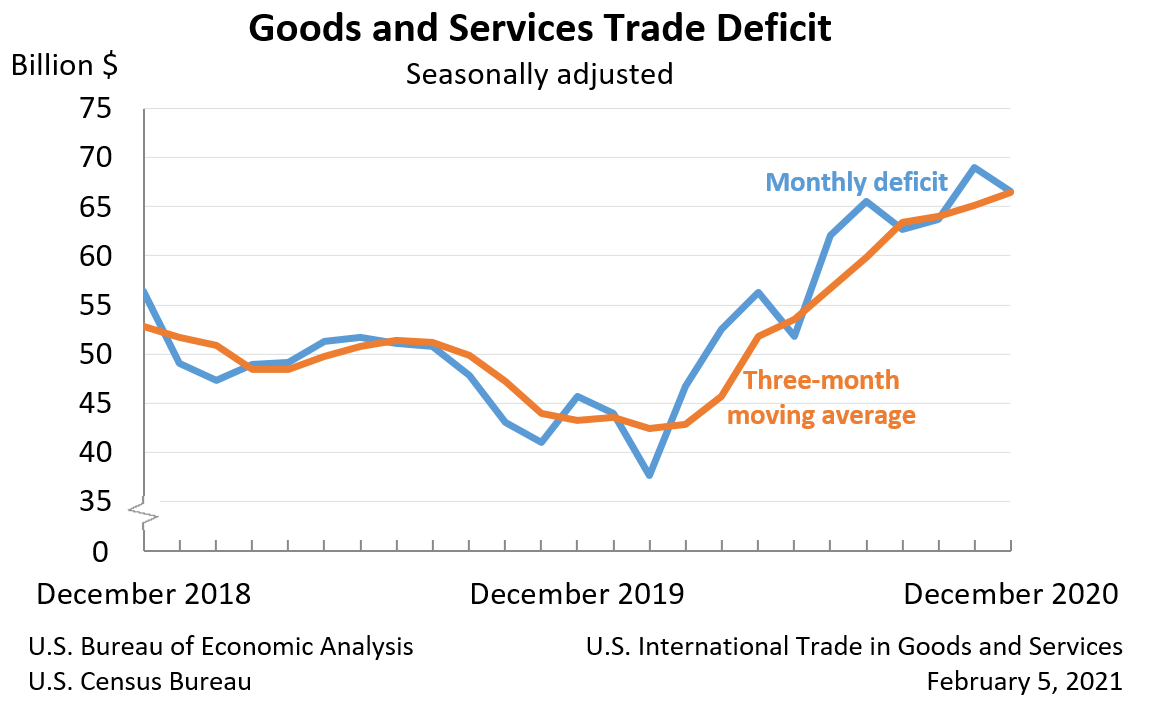
The U.S. Census Bureau and the U.S. Bureau of Economic Analysis announced today that the goods and services deficit was $66.6 billion in December, down $2.4 billion from $69.0 billion in November, revised.
| Deficit: |
$66.6 Billion |
-3.5%° |
| Exports: |
$190.0 Billion |
+3.4%° |
| Imports: |
$256.6 Billion |
+1.5%° |
|
Next release: March 5, 2021 (°) Statistical significance is not applicable or not measurable. Data adjusted for seasonality but not price changes Source: U.S. Census Bureau, U.S. Bureau of Economic Analysis; U.S. International Trade in Goods and Services, February 5, 2021 |
||
Exports and imports in December 2020 reflect both the ongoing impact of the COVID-19 pandemic and the continued economic recovery from the sharp declines earlier in the year. The full economic effects of the pandemic cannot be quantified in the trade statistics because the impacts are generally embedded in source data and cannot be separately identified. The Census Bureau and the Bureau of Economic Analysis continue to monitor data quality and have determined estimates in this release meet publication standards. For more information, see the frequently asked questions on goods from the Census Bureau and on services from BEA.
Exports, Imports, and Balance (exhibit 1)
December exports were $190.0 billion, $6.2 billion more than November exports. December imports were $256.6 billion, $3.8 billion more than November imports.
The December decrease in the goods and services deficit reflected a decrease in the goods deficit of $2.8 billion to $84.2 billion and a decrease in the services surplus of $0.4 billion to $17.5 billion.
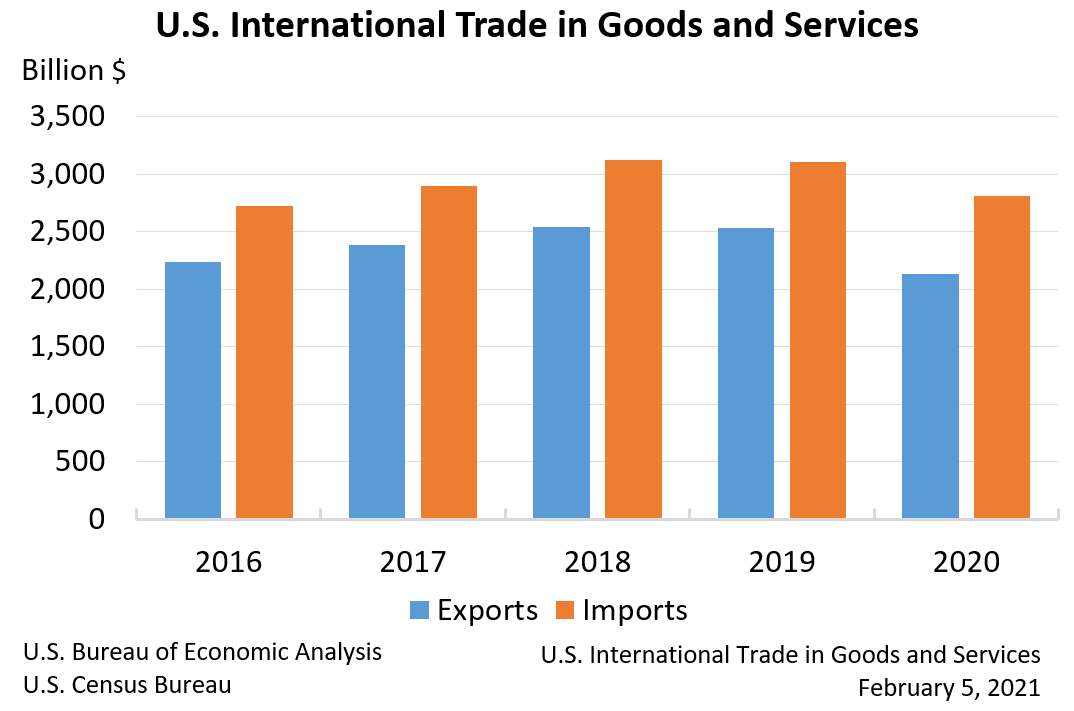
For 2020, the goods and services deficit increased $101.9 billion, or 17.7 percent, from 2019. Exports decreased $396.4 billion or 15.7 percent. Imports decreased $294.5 billion or 9.5 percent.
Three-Month Moving Averages (exhibit 2)
The average goods and services deficit increased $1.3 billion to $66.5 billion for the three months ending in December.
- Average exports increased $4.0 billion to $185.2 billion in December.
- Average imports increased $5.3 billion to $251.6 billion in December.
Year-over-year, the average goods and services deficit increased $23.2 billion from the three months ending in December 2019.
- Average exports decreased $25.7 billion from December 2019.
- Average imports decreased $2.5 billion from December 2019.
Exports (exhibits 3, 6, and 7)
Exports of goods increased $6.0 billion to $133.5 billion in December.
Exports of goods on a Census basis increased $5.9 billion.
- Industrial supplies and materials increased $1.8 billion.
- Crude oil increased $1.3 billion.
- Foods, feeds, and beverages increased $1.4 billion.
- Soybeans increased $1.0 billion.
- Capital goods increased $1.1 billion.
- Automotive vehicles, parts, and engines increased $0.9 billion.
Net balance of payments adjustments increased $0.1 billion.
Exports of services increased $0.3 billion to $56.5 billion in December.
- Travel increased $0.2 billion.
Imports (exhibits 4, 6, and 8)
Imports of goods increased $3.1 billion to $217.7 billion in December.
Imports of goods on a Census basis increased $3.0 billion.
- Industrial supplies and materials increased $2.7 billion.
- Finished metal shapes increased $1.2 billion.
- Other petroleum products increased $0.4 billion.
- Crude oil increased $0.4 billion.
- Automotive vehicles, parts, and engines increased $2.0 billion.
- Passenger cars increased $1.6 billion.
- Consumer goods decreased $1.9 billion.
- Cell phones and other household goods decreased $1.5 billion.
- Pharmaceutical preparations decreased $1.1 billion.
Net balance of payments adjustments increased $0.2 billion.
Imports of services increased $0.7 billion to $38.9 billion in December.
- Travel increased $0.5 billion.
- Transport increased $0.2 billion.
Real Goods in 2012 Dollars – Census Basis (exhibit 11)
The real goods deficit decreased $2.4 billion to $94.8 billion in December.
- Real exports of goods increased $4.0 billion to $148.4 billion.
- Real imports of goods increased $1.6 billion to $243.2 billion.
Revisions
In addition to revisions to source data for the November statistics, the seasonally adjusted goods data were revised for January through November so that the totals of the seasonally adjusted months equal the annual totals.
Revisions to November exports
- Exports of goods were revised down $0.2 billion.
- Exports of services were revised down $0.2 billion.
Revisions to November imports
- Imports of goods were revised up $0.5 billion.
- Imports of services were revised down less than $0.1 billion.
Goods by Selected Countries and Areas: Monthly – Census Basis (exhibit 19)
The December figures show surpluses, in billions of dollars, with South and Central America ($3.9), Hong Kong ($2.1), OPEC ($1.9), Brazil ($0.8), Saudi Arabia ($0.6), and United Kingdom ($0.2). Deficits were recorded, in billions of dollars, with China ($28.1), European Union ($19.2), Mexico ($10.3), Germany ($5.8), Japan ($5.5), Taiwan ($3.2), Italy ($3.2), India ($2.8), South Korea ($2.7), France ($1.6), Canada ($1.1), and Singapore ($0.9).
- The deficit with China decreased $2.3 billion to $28.1 billion in December. Exports increased $0.8 billion to $13.5 billion and imports decreased $1.5 billion to $41.7 billion.
- The deficit with Japan decreased $1.1 billion to $5.5 billion in December. Exports increased $0.3 billion to $5.5 billion and imports decreased $0.8 billion to $11.0 billion.
- The deficit with the European Union increased $2.5 billion to $19.2 billion in December. Exports decreased $0.7 billion to $19.7 billion and imports increased $1.7 billion to $38.9 billion.
Annual Summary for 2020
Exports, Imports, and Balance (exhibit 1)
For 2020, the goods and services deficit was $678.7 billion, up $101.9 billion from $576.9 billion in 2019. Exports were $2,131.9 billion, down $396.4 billion from 2019. Imports were $2,810.6 billion, down $294.5 billion from 2019.
The 2020 increase in the goods and services deficit reflected an increase in the goods deficit of $51.5 billion, or 6.0 percent, to $915.8 billion and a decrease in the services surplus of $50.4 billion, or 17.5 percent, to $237.1 billion.
As a percentage of U.S. gross domestic product, the goods and services deficit was 3.2 percent in 2020, up from 2.7 percent in 2019.
Exports (exhibits 3, 6, and 7)
Exports of goods decreased $217.7 billion to $1,434.8 billion in 2020.
Exports of goods on a Census basis decreased $211.5 billion.
- Capital goods decreased $87.5 billion.
- Civilian aircraft decreased $27.4 billion.
- Civilian aircraft engines decreased $18.4 billion.
- Industrial supplies and materials decreased $59.2 billion.
- Other petroleum products decreased $15.5 billion.
- Crude oil decreased $14.8 billion.
- Fuel oil decreased $13.3 billion.
- Automotive vehicles, parts, and engines decreased $35.3 billion.
- Automotive parts and accessories decreased $13.3 billion.
- Passenger cars decreased $10.5 billion.
- Consumer goods decreased $30.8 billion.
- Gem diamonds decreased $8.5 billion.
- Artwork, antiques, and other collectibles decreased $4.5 billion.
- Jewelry decreased $4.4 billion.
Net balance of payments adjustments decreased $6.1 billion.
Exports of services decreased $178.7 billion to $697.1 billion in 2020.
- Travel decreased $117.2 billion.
- Transport decreased $34.7 billion.
Imports (exhibits 4, 6, and 8)
Imports of goods decreased $166.2 billion to $2,350.6 billion in 2020.
Imports of goods on a Census basis decreased $161.0 billion.
- Automotive vehicles, parts, and engines decreased $65.2 billion.
- Passenger cars decreased $33.4 billion.
- Automotive parts and accessories decreased $15.3 billion.
- Trucks, buses, and special purpose vehicles decreased $10.8 billion.
- Industrial supplies and materials decreased $42.3 billion.
- Crude oil decreased $50.2 billion.
- Other petroleum products decreased $16.5 billion.
- Nonmonetary gold increased $25.1 billion.
- Finished metal shapes increased $23.7 billion.
- Capital goods decreased $31.2 billion.
- Civilian aircraft engines decreased $11.1 billion.
- Other industrial machinery decreased $6.7 billion.
- Civilian aircraft parts decreased $6.7 billion.
- Computers increased $11.5 billion.
Net balance of payments adjustments decreased $5.3 billion.
Imports of services decreased $128.3 billion to $460.1 billion in 2020.
- Travel decreased $95.3 billion.
- Transport decreased $35.9 billion.
Goods by Selected Countries and Areas – Census Basis (exhibits 14 and 14a)
The 2020 figures show surpluses, in billions of dollars, with South and Central America ($39.8), Netherlands ($18.1), Hong Kong ($16.1), OPEC ($15.7), Brazil ($11.7), Australia ($9.1), United Kingdom ($8.8), and Belgium ($6.7). Deficits were recorded, in billions of dollars, with China ($310.8), European Union ($183.4), Mexico ($112.7), Germany ($57.3), Switzerland ($56.7), Ireland ($55.9), Japan ($55.4), Malaysia ($31.7), Taiwan ($29.9), Italy ($29.5), Thailand ($26.4), South Korea ($24.8), India ($23.8), France ($15.6), Canada ($15.0), Indonesia ($12.8), and Russia ($12.0).
- The deficit with Switzerland increased $30.0 billion to $56.7 billion in 2020. Exports increased $0.1 billion to $18.0 billion and imports increased $30.1 billion to $74.8 billion.
- The surplus with South and Central America decreased $13.0 billion to $39.8 billion in 2020. Exports decreased $31.2 billion to $130.5 billion and imports decreased $18.2 billion to $90.7 billion.
- The deficit with China decreased $34.4 billion to $310.8 billion in 2020. Exports increased $18.2 billion to $124.6 billion and imports decreased $16.2 billion to $435.4 billion.
* * *
All statistics referenced are seasonally adjusted; statistics are on a balance of payments basis unless otherwise specified. Additional statistics, including not seasonally adjusted statistics and details for goods on a Census basis, are available in exhibits 1-20b of this release. For information on data sources, definitions, and revision procedures, see the explanatory notes in this release. The full release can be found at www.census.gov/foreign-trade/Press-Release/current_press_release/index.html or www.bea.gov/data/intl-trade-investment/international-trade-goods-and-services. The full schedule is available in the Census Bureau's Economic Briefing Room at www.census.gov/economic-indicators/ or on BEA's website at www.bea.gov/news/schedule.
* * *
Next release: March 5, 2021, at 8:30 A.M. EST
U.S. International Trade in Goods and Services, January 2021
* * *
Discontinuation of the Organization of the Petroleum Exporting Countries (OPEC) Grouping
The OPEC grouping will be discontinued with the release of the "U.S. International Trade in Goods and Services, January 2021" (FT-900) report on March 5, 2021. This change will affect exhibits 14, 14a, 17a, 19, 20, 20a, and 20b of the FT-900 and exhibits 4 and 4a of the FT-900 Supplement. Previews of the modified exhibits are available at www.census.gov/foreign-trade/statistics/notices/no-opec-templates-ft900.xlsx.
Data for goods on a Census basis for OPEC member countries will continue to be available on USA Trade Online, the U.S. Census Bureau's free online database, as well as on the Census Bureau's application programming interface (API).
If you have questions or need additional information, please contact the Census Bureau, Economic Indicators Division, International Trade Macro Analysis Branch, on (800) 549-0595, option 4, or at eid.international.trade.data@census.gov or the U.S. Bureau of Economic Analysis, Balance of Payments Division, at InternationalAccounts@bea.gov.
Change in Definition of Agricultural Products
With the release of the FT-900 on March 5, 2021, the Census Bureau, in coordination with the U.S. Department of Agriculture (USDA), will adopt the World Trade Organization’s internationally recognized definition of agricultural products as its standard definition for the statistical reporting of U.S. agricultural trade. More information on this change will be available later this month from USDA’s Foreign Agricultural Service.
This change will affect the composition of the series “Agricultural Commodities” in exhibit 15 of the FT-900, in the Census Bureau’s API, and in exhibit 14 of the FT-900 Annual Revision to be released on June 8, 2021. This change will also be reflected in the 2021 export and import classification concordances that will be released on March 5, 2021, along with the FT-900.
For questions regarding goods trade statistics, please contact the Census Bureau, Economic Indicators Division, International Trade Macro Analysis Branch, on (800) 549-0595, option 4, or at eid.international.trade.data@census.gov. For questions regarding the definition of agricultural products, please contact Jason Carver, Trade and Economic Analysis, Global Market Analysis, USDA Foreign Agricultural Service, on (202) 720-1063 or at jason.carver@usda.gov.