
News Release
Gross Domestic Product, Fourth Quarter and Year 2022 (Second Estimate)
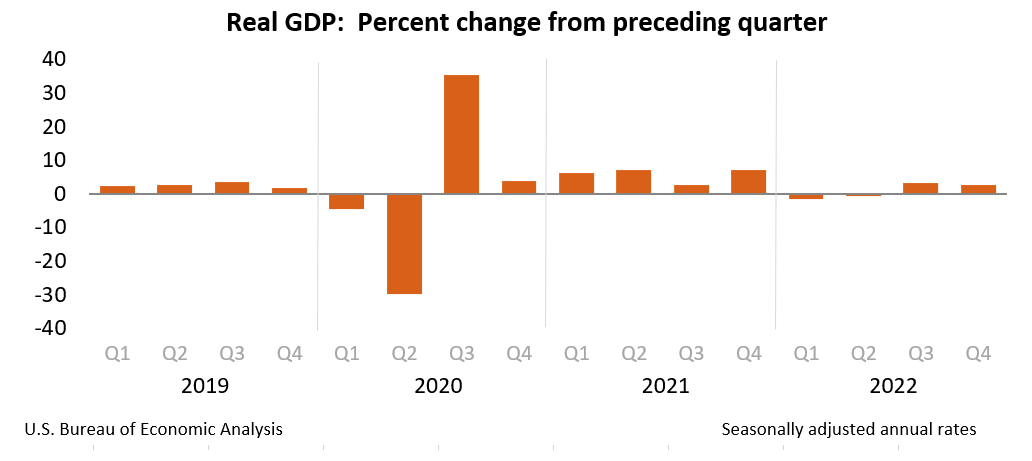
Real gross domestic product (GDP) increased at an annual rate of 2.7 percent in the fourth quarter of 2022 (table 1), according to the "second" estimate released by the Bureau of Economic Analysis. In the third quarter, real GDP increased 3.2 percent.
The GDP estimate released today is based on more complete source data than were available for the "advance" estimate issued last month. In the advance estimate, the increase in real GDP was 2.9 percent. The updated estimates primarily reflected a downward revision to consumer spending that was partly offset by an upward revision to nonresidential fixed investment (refer to "Updates to GDP"). Imports, which are a subtraction in the calculation of GDP, were revised up.
The increase in real GDP in the fourth quarter reflected increases in private inventory investment, consumer spending, nonresidential fixed investment, federal government spending, and state and local government spending that were partly offset by decreases in residential fixed investment and exports. Imports decreased (table 2).
The increase in private inventory investment was led by manufacturing (mainly petroleum and coal products) as well as mining, utilities, and construction industries (led by utilities). The increase in consumer spending reflected an increase in services that was partly offset by a decrease in goods. Within services, the increase was led by health care as well as housing and utilities. Within goods, the leading contributor to the decrease was "other" durable goods (mainly jewelry). Within nonresidential fixed investment, increases in intellectual property products (mainly software) and structures were partly offset by a decrease in equipment. Within federal government spending, the increase was led by nondefense spending. The increase in state and local government spending primarily reflected an increase in compensation of state and local government employees.
Within residential fixed investment, the leading contributors to the decrease were new single-family construction and brokers' commissions. Within exports, a decrease in goods (led by nondurable goods excluding petroleum) was partly offset by an increase in services (led by travel as well as transport). Within imports, a decrease in goods (led by durable consumer goods) was partly offset by an increase in services (led by travel).
Compared to the third quarter, the deceleration in real GDP in the fourth quarter primarily reflected a downturn in exports and decelerations in consumer spending, nonresidential fixed investment, and state and local government spending. These movements were partly offset by an upturn in private inventory investment, a smaller decrease in residential fixed investment, and an acceleration in federal government spending. Imports decreased less in the fourth quarter than in the third quarter.
Current‑dollar GDP increased 6.7 percent at an annual rate, or $421.1 billion, in the fourth quarter to a level of $26.15 trillion, an upward revision of 0.2 percentage point, or $12.5 billion, from the previous estimate. More information on the source data that underlie the estimates is available in the "Key Source Data and Assumptions" file.
The price index for gross domestic purchases increased 3.6 percent in the fourth quarter, an upward revision of 0.4 percentage point from the previous estimate. The personal consumption expenditures (PCE) price index increased 3.7 percent, an upward revision of 0.5 percentage point. Excluding food and energy prices, the PCE price index increased 4.3 percent, an upward revision of 0.4 percentage point.
Personal Income
Current-dollar personal income increased $388.1 billion in the fourth quarter, an upward revision of $77.1 billion from the previous estimate. The increase primarily reflected increases in compensation (led by private wages and salaries) and government social benefits (table 8). Within government social benefits, the increase primarily reflected an increase in "other" benefits reflecting state stimulus payments to individuals in the form of one-time refundable tax credits. Disposable personal income increased $392.1 billion, or 8.6 percent, in the fourth quarter, an upward revision of $95.1 billion from the previous estimate. Real disposable personal income increased 4.8 percent, an upward revision of 1.5 percentage points from the previous estimate.
Personal saving was $755.0 billion in the fourth quarter, an upward revision of $101.3 billion from the previous estimate. The personal saving rate—personal saving as a percentage of disposable personal income—was 3.9 percent in the fourth quarter, an upward revision of 0.5 percentage point from the previous estimate.
Updates to GDP
With the second estimate, downward revisions to consumer spending and exports were partly offset by upward revisions to nonresidential and residential fixed investment. Imports were revised up. For more details, refer to the Technical Note. For information on updates to GDP, refer to the "Additional Information" section that follows.
| Advance Estimate | Second Estimate | |
|---|---|---|
| (Percent change from preceding quarter) | ||
| Real GDP | 2.9 | 2.7 |
| Current-dollar GDP | 6.5 | 6.7 |
| Gross domestic purchases price index | 3.2 | 3.6 |
| PCE price index | 3.2 | 3.7 |
| PCE price index excluding food and energy | 3.9 | 4.3 |
Updates to Third-Quarter Wages and Salaries
In addition to presenting updated estimates for the fourth quarter, today's release presents revised estimates of third-quarter wages and salaries, personal taxes, and contributions for government social insurance, based on updated data from the Bureau of Labor Statistics Quarterly Census of Employment and Wages program. Wages and salaries are now estimated to have increased $303.0 billion in the third quarter, an upward revision of $115.2 billion. Personal current taxes are now estimated to have increased $48.0 billion, an upward revision of $7.3 billion. Contributions for government social insurance are now estimated to have increased $41.2 billion, an upward revision of $14.8 billion. With the incorporation of these new data, real gross domestic income is now estimated to have increased 2.8 percent in the third quarter, an upward revision of 2.0 percentage points from the previously published estimate.
GDP for 2022
Real GDP increased 2.1 percent in 2022 (from the 2021 annual level to the 2022 annual level), compared with an increase of 5.9 percent in 2021 (table 1). The increase in real GDP in 2022 primarily reflected increases in consumer spending, exports, private inventory investment, and nonresidential fixed investment that were partly offset by decreases in residential fixed investment and federal government spending. Imports increased (table 2).
Current-dollar GDP increased 9.2 percent, or $2.15 trillion, in 2022 to a level of $25.46 trillion, compared with an increase of 10.7 percent, or $2.25 trillion, in 2021 (tables 1 and 3).
The price index for gross domestic purchases increased 6.8 percent in 2022, compared with an increase of 4.2 percent in 2021 (table 4). The PCE price index increased 6.3 percent, compared with an increase of 4.0 percent. Excluding food and energy prices, the PCE price index increased 5.0 percent, compared with an increase of 3.5 percent.
Measured from the fourth quarter of 2021 to the fourth quarter of 2022, real GDP increased 0.9 percent during the period (table 5), compared with an increase of 5.7 percent from the fourth quarter of 2020 to the fourth quarter of 2021.
The price index for gross domestic purchases, as measured from the fourth quarter of 2021 to the fourth quarter of 2022, increased 6.2 percent, compared with an increase of 5.8 percent from the fourth quarter of 2020 to the fourth quarter of 2021. The PCE price index increased 5.7 percent, the same increase as from the fourth quarter of 2020 to the fourth quarter of 2021. Excluding food and energy, the PCE price index increased 4.8 percent, compared with an increase of 4.7 percent.
| Advance Estimate | Second Estimate | |
|---|---|---|
| (Percent change from 2021 annual level to 2022 annual level) | ||
| Real GDP | 2.1 | 2.1 |
| Current-dollar GDP | 9.2 | 9.2 |
| Gross domestic purchases price index | 6.8 | 6.8 |
| PCE price index | 6.2 | 6.3 |
| PCE price index excluding food and energy | 5.0 | 5.0 |
| (Percent change from fourth quarter 2021 to fourth quarter 2022) | ||
| Real GDP | 1.0 | 0.9 |
| Gross domestic purchases price index | 6.1 | 6.2 |
| PCE price index | 5.5 | 5.7 |
| PCE price index excluding food and energy | 4.7 | 4.8 |
* * *
Next release, March 30, 2023, at 8:30 a.m. EDT
Gross Domestic Product (Third Estimate)
Corporate Profits
Gross Domestic Product by Industry
Fourth Quarter 2022 and Year 2022