BEA 22-66
Scheduled Date
December 23 10:00:am
Release Title
Gross Domestic Product by State, 3rd Quarter 2022

An official website of the United States government
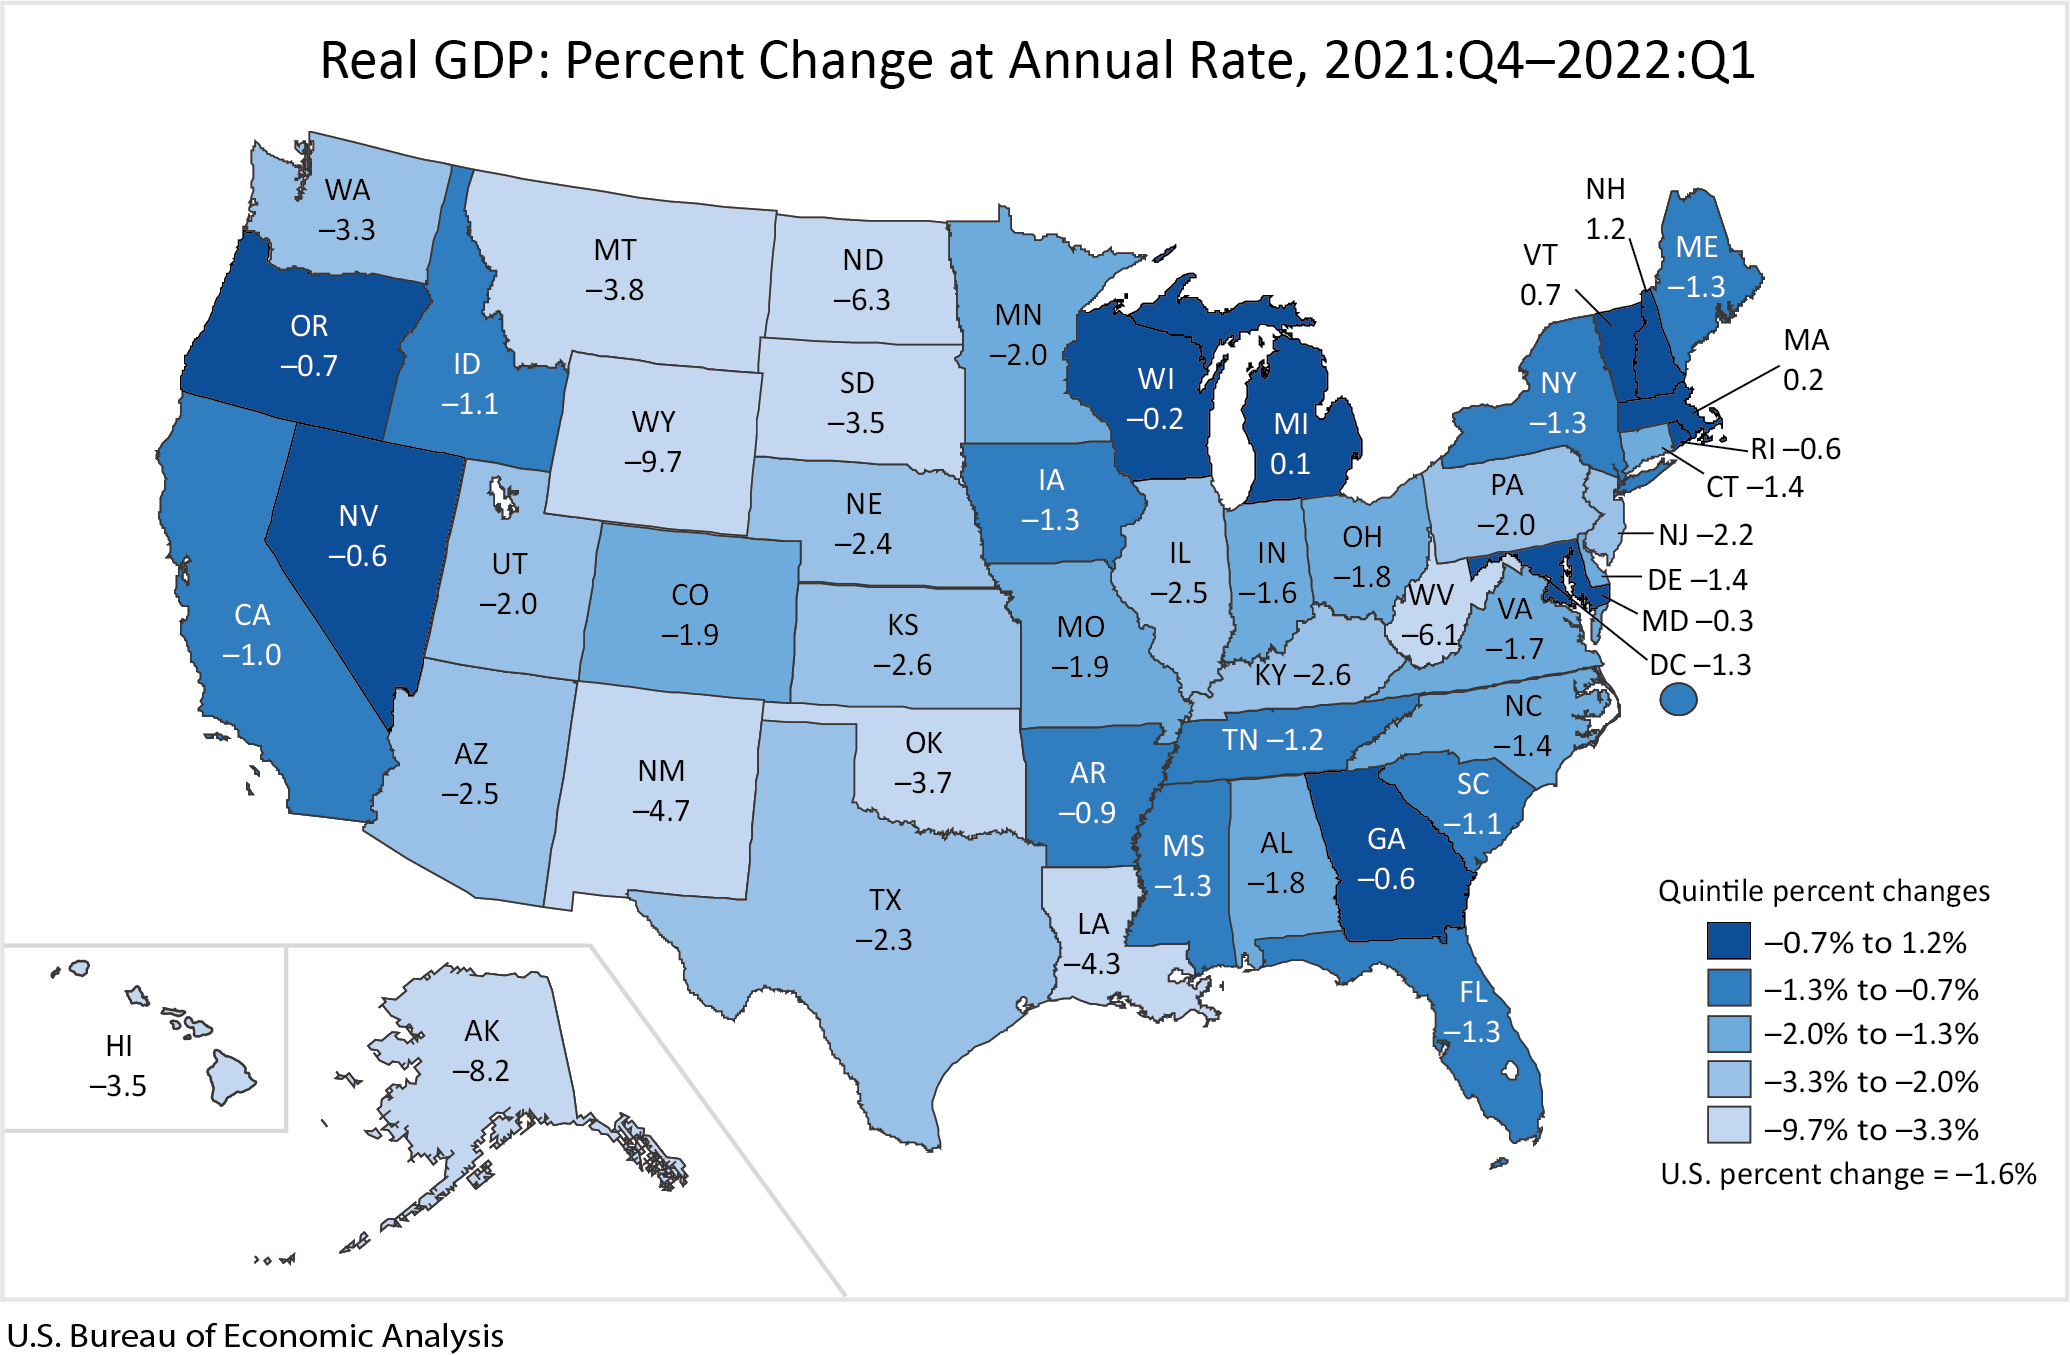
Real gross domestic product (GDP) decreased in 46 states and the District of Columbia in the first quarter of 2022, as real GDP for the nation decreased at an annual rate of 1.6 percent. The percent change in real GDP in the first quarter ranged from 1.2 percent in New Hampshire to –9.7 percent in Wyoming.
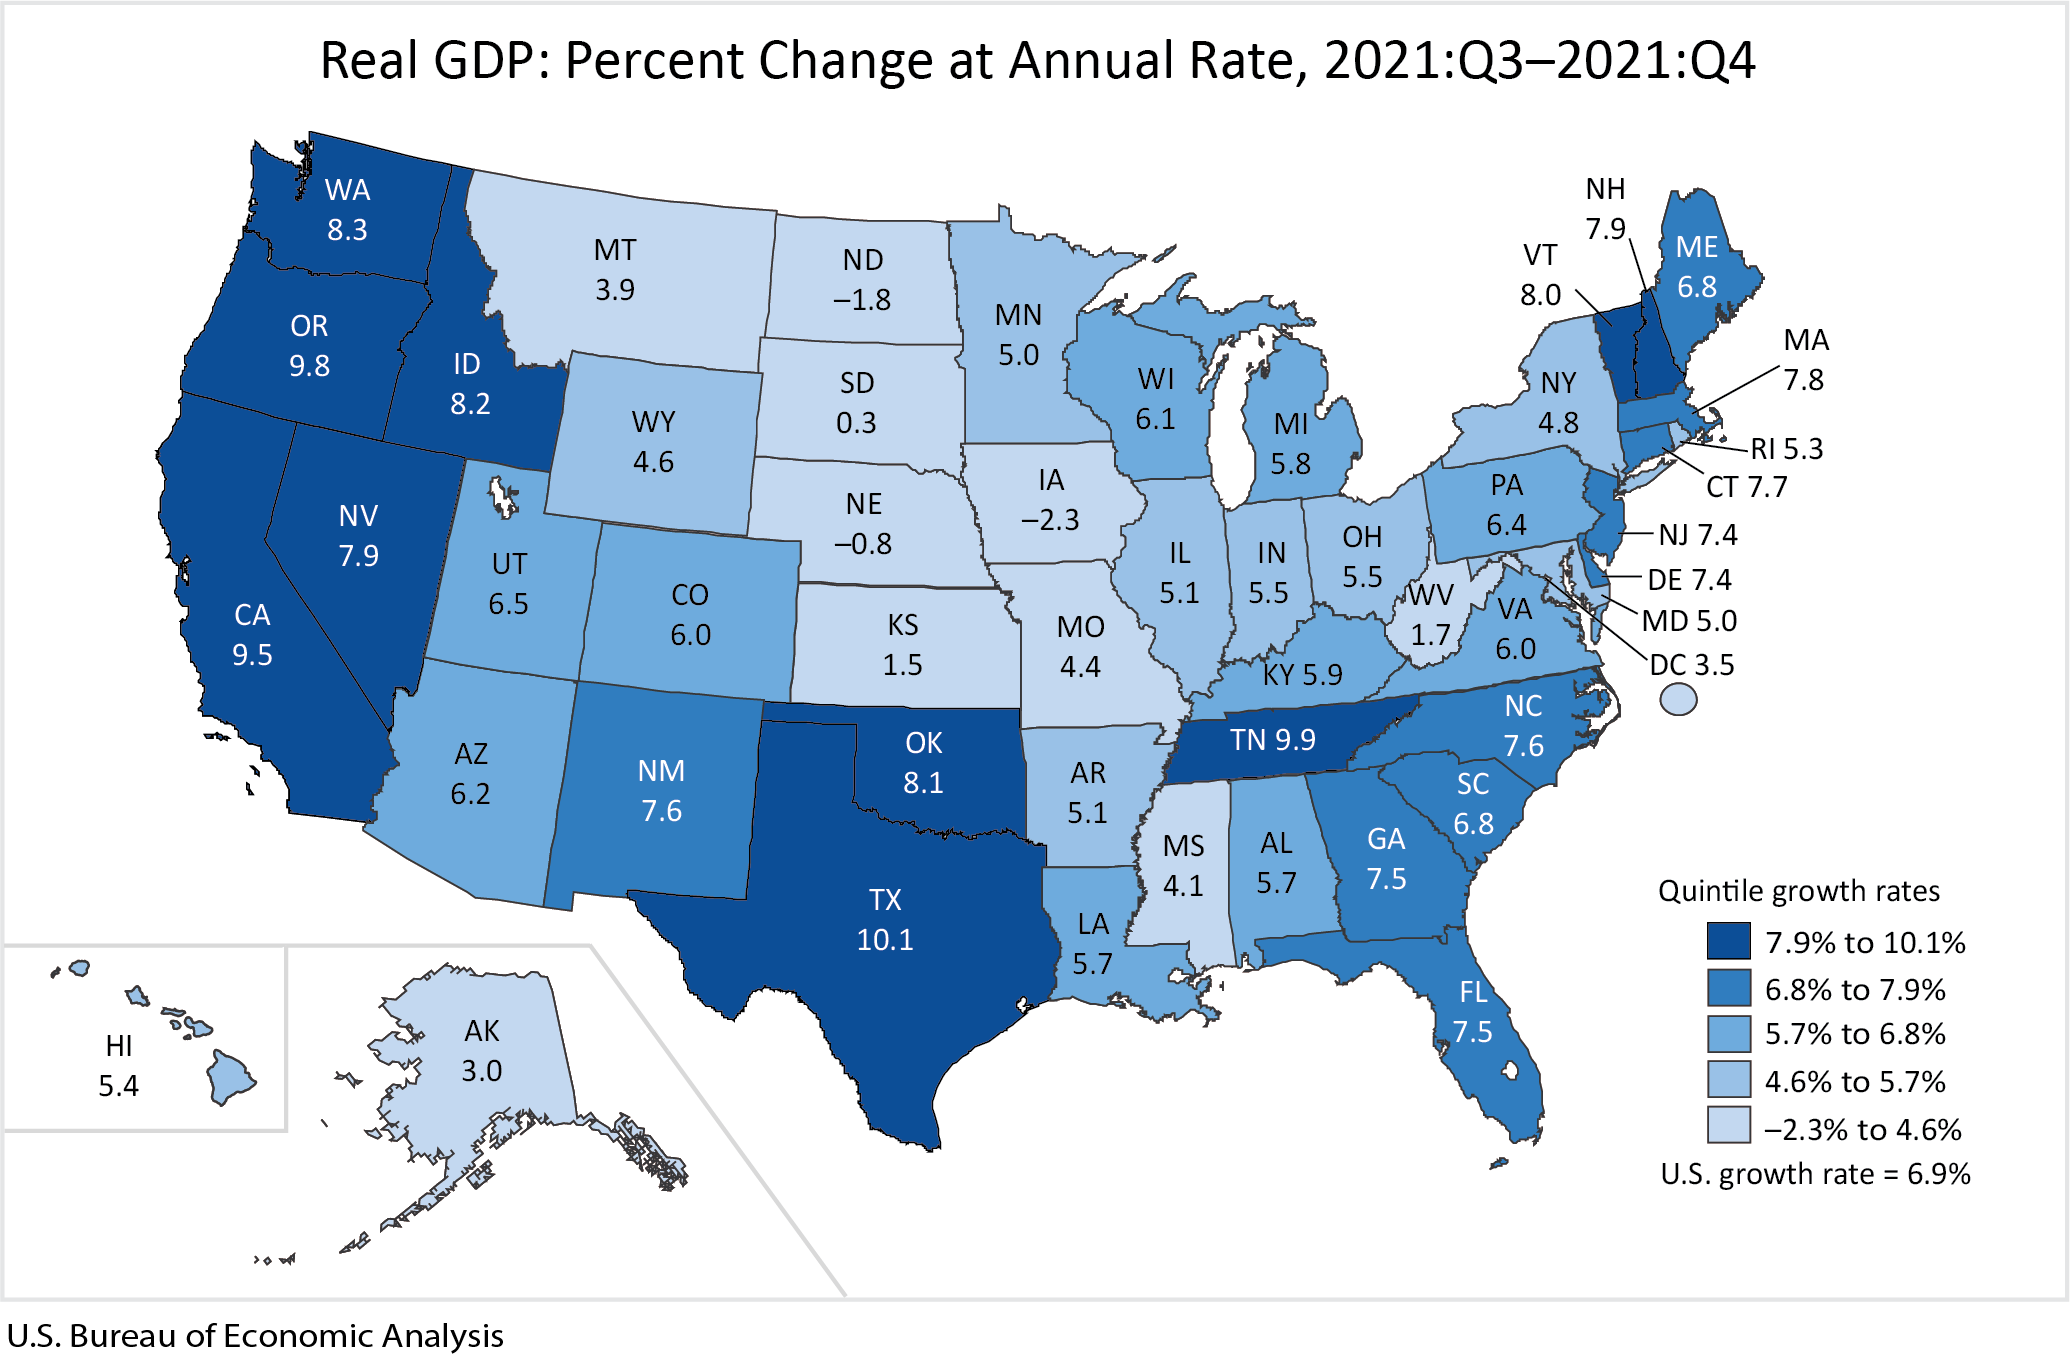
Real gross domestic product (GDP) increased in 47 states and the District of Columbia in the fourth quarter of 2021, as real GDP for the nation increased at an annual rate of 6.9 percent, according to statistics released today by the U.S. Bureau of Economic Analysis. The percent change in real GDP in the fourth quarter ranged from 10.1 percent in Texas to –2.3 percent in Iowa.
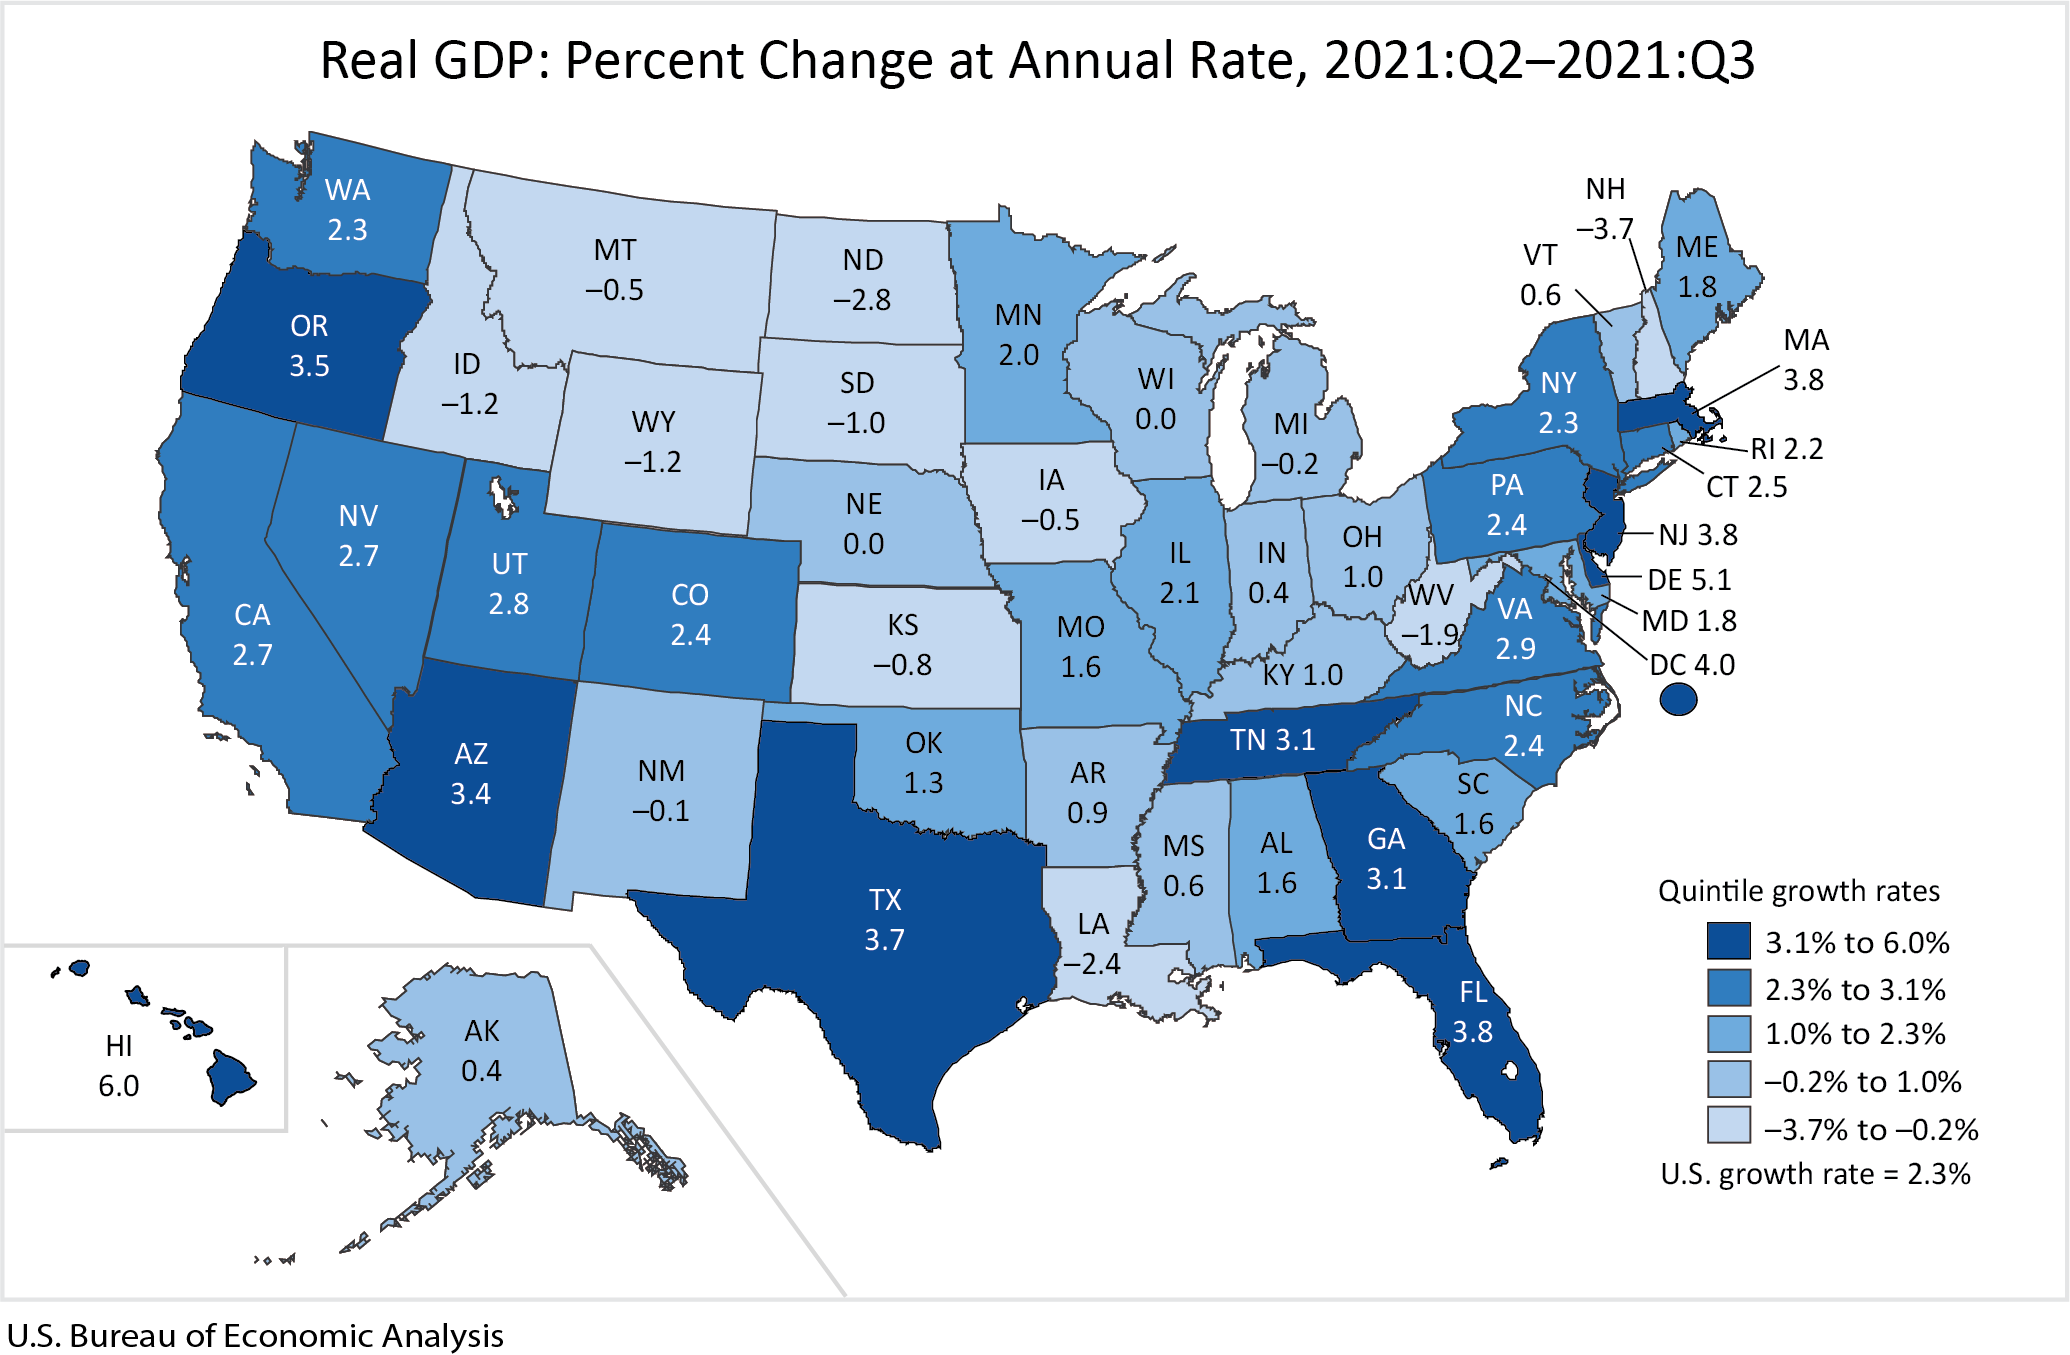
Real gross domestic product (GDP) increased in 36 states and the District of Columbia in the third quarter of 2021, as real GDP for the nation increased at an annual rate of 2.3 percent, according to statistics released today by the U.S. Bureau of Economic Analysis (BEA). The percent change in real GDP in the third quarter ranged from 6.0 percent in Hawaii to –3.7 percent in New Hampshire.
Real gross domestic product (GDP) increased in all 50 states and the District of Columbia in the second quarter of 2021, as real GDP for the nation increased at an annual rate of 6.7 percent. The percent change in real GDP in the second quarter ranged from 9.7 percent in Nevada to 1.8 percent in Alaska.
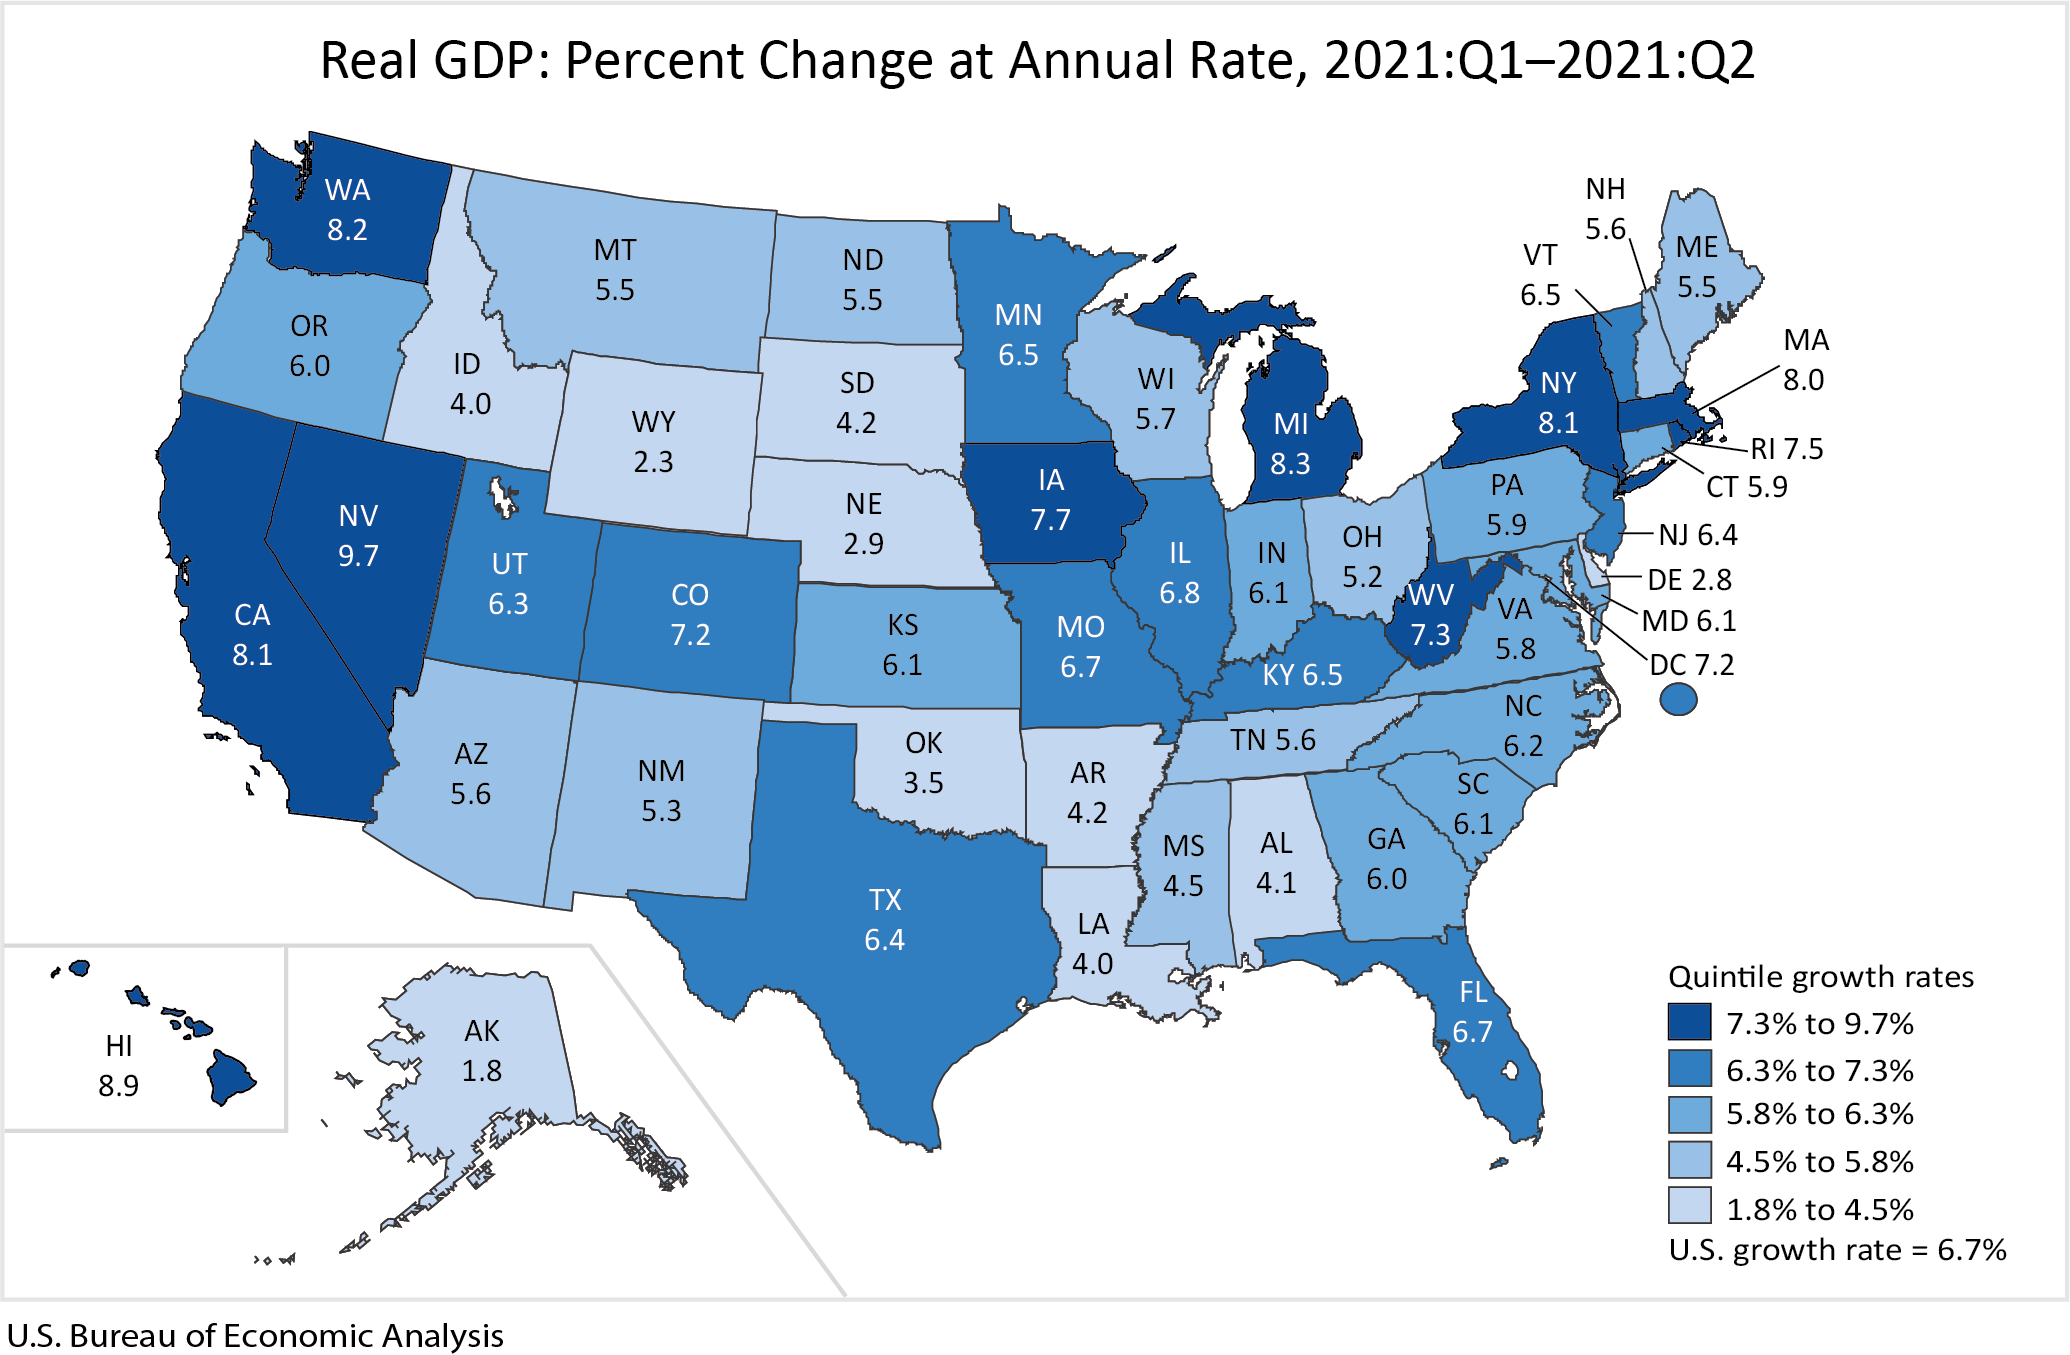
Real gross domestic product (GDP) increased in all 50 states and the District of Columbia in the first quarter of 2021, as real GDP for the nation increased at an annual rate of 6.4 percent. The percent change in real GDP in the first quarter ranged from 10.9 percent in Nevada to 2.9 percent in the District of Columbia.
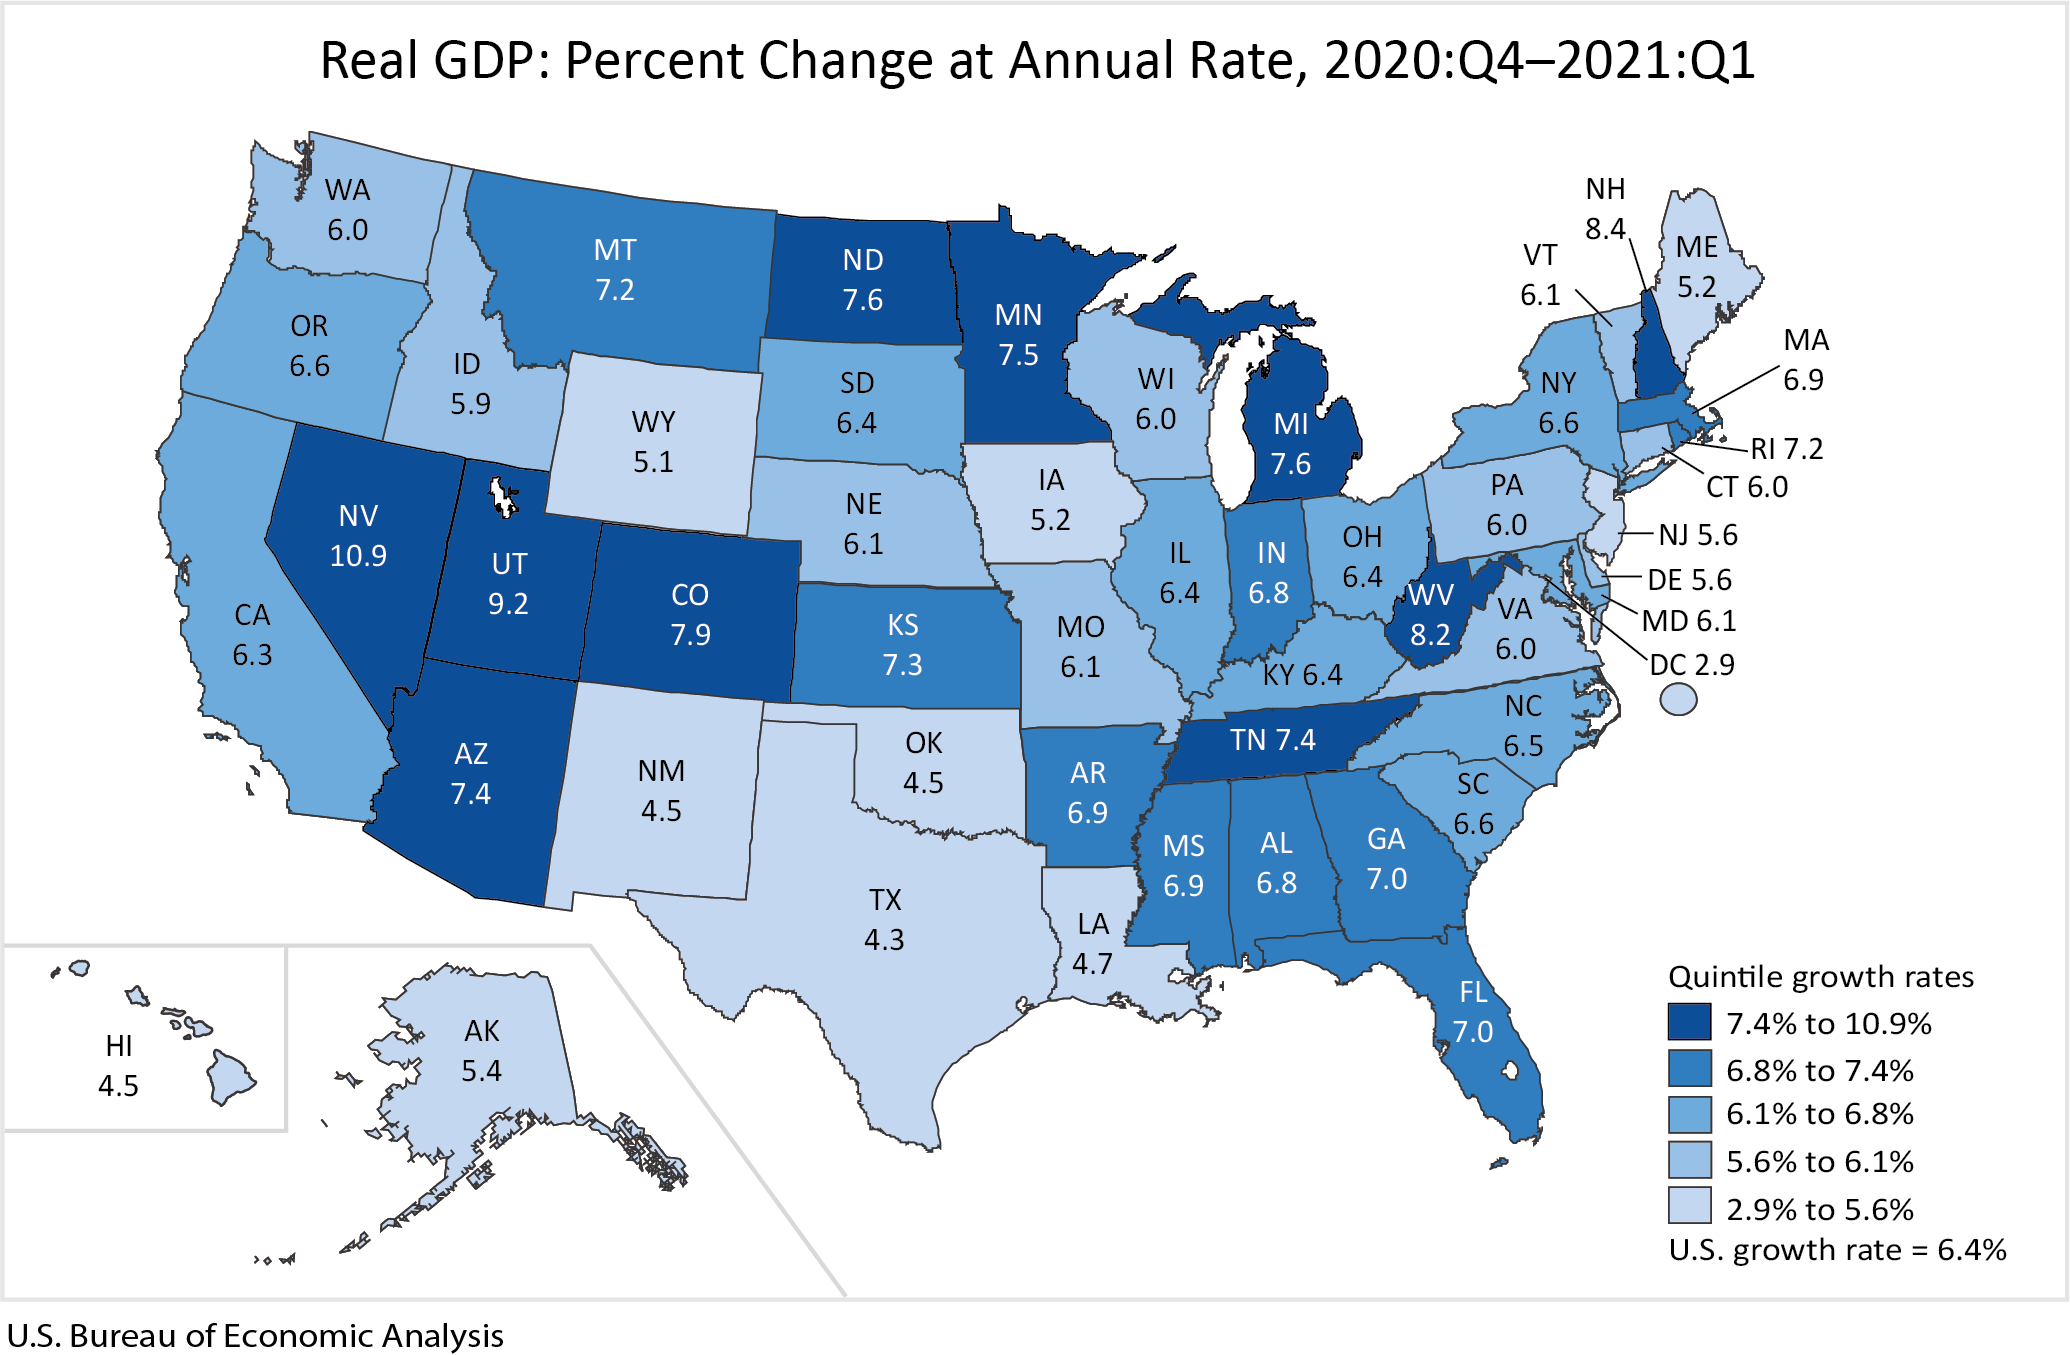
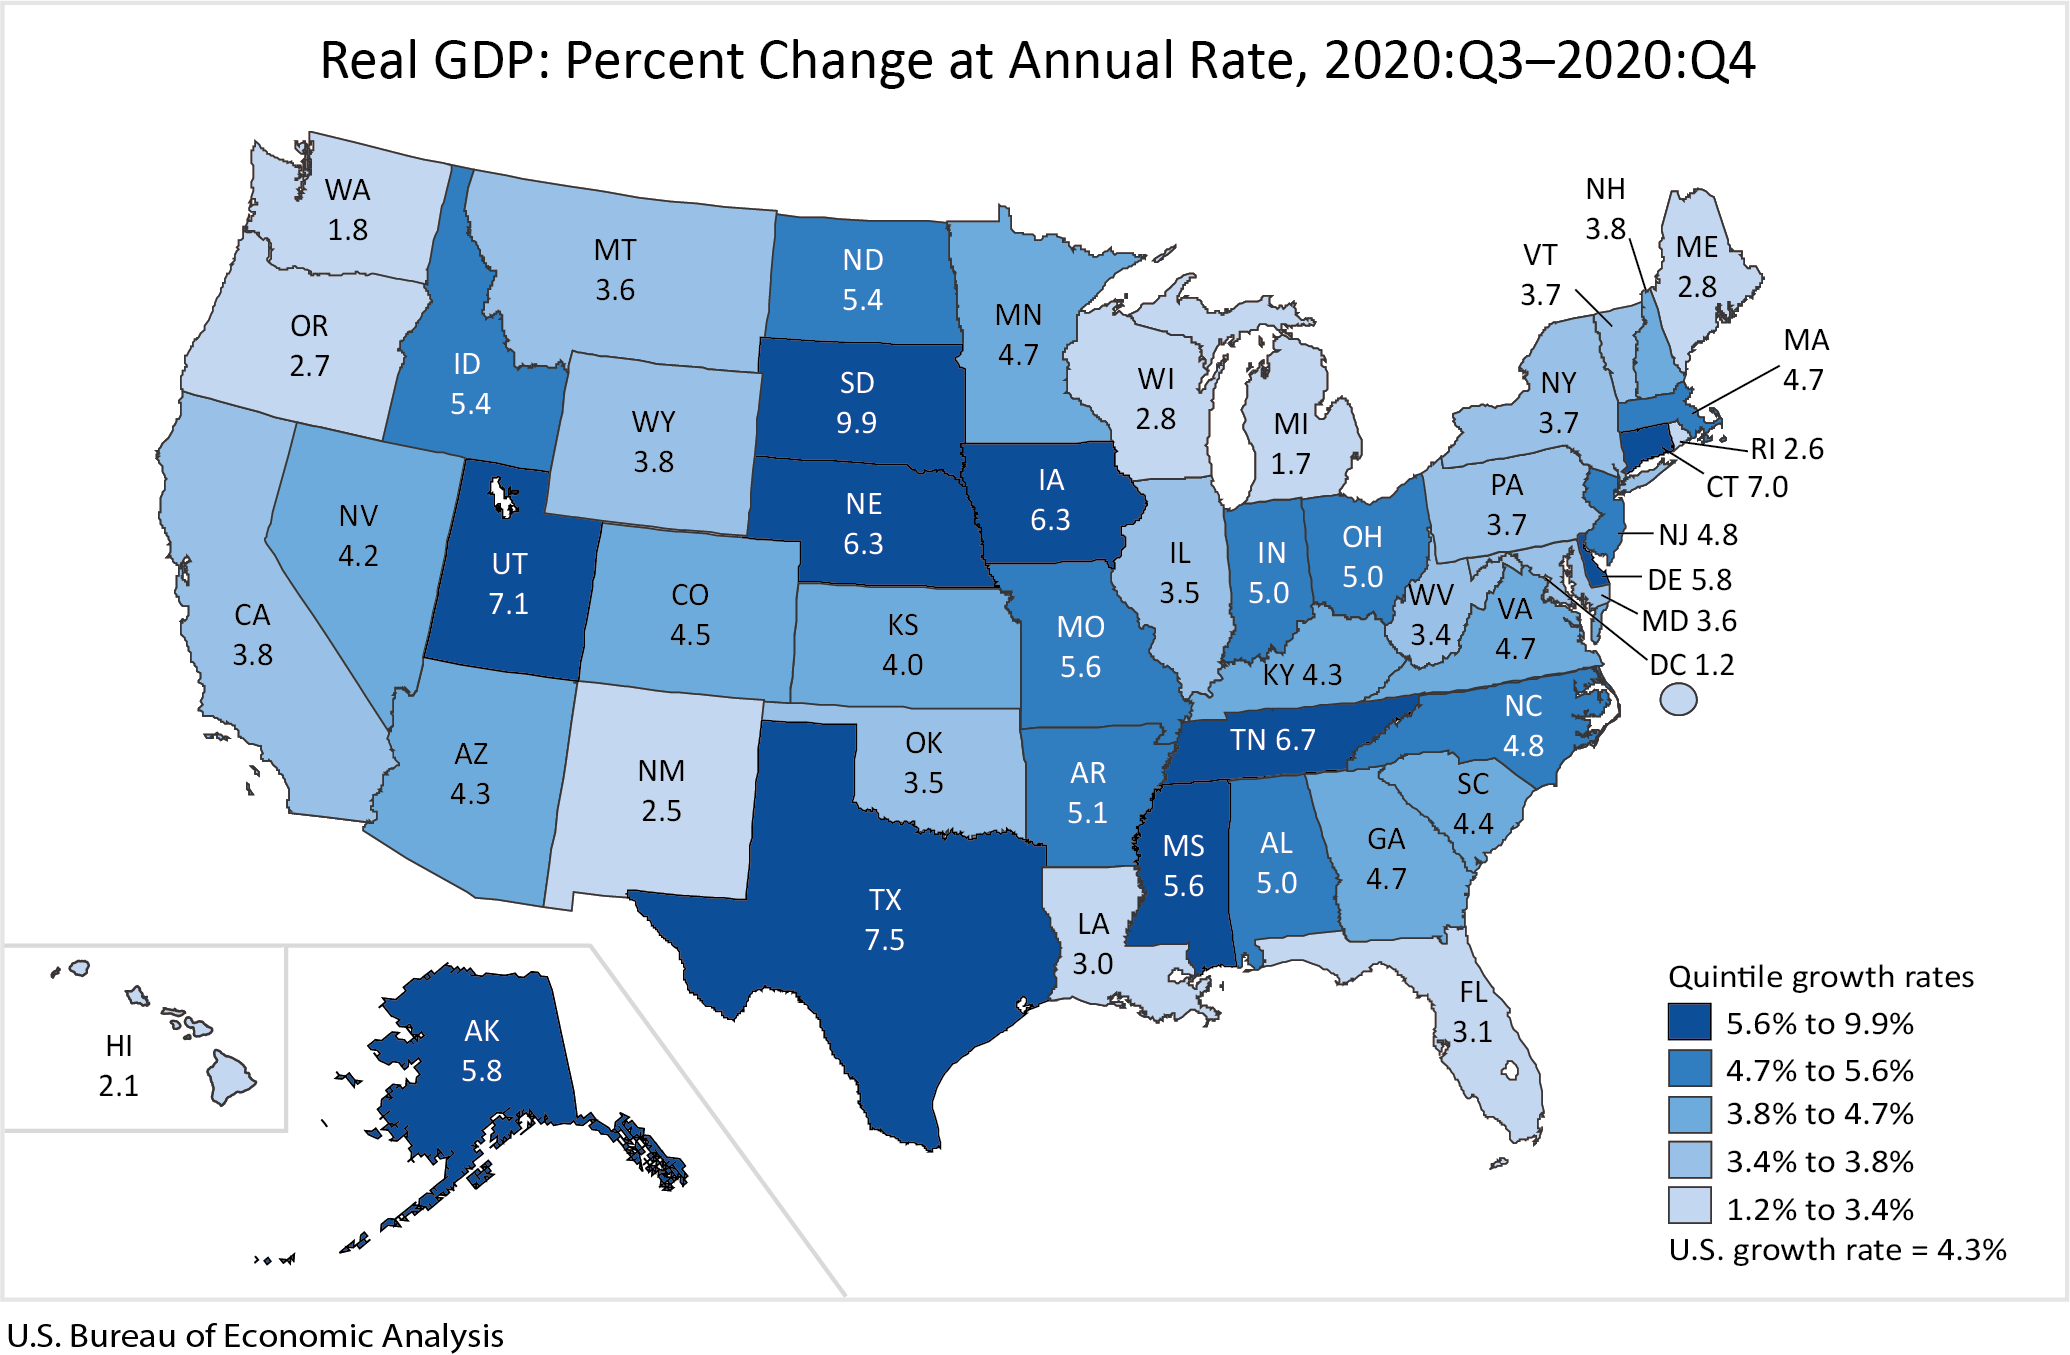
Real gross domestic product (GDP) increased in all 50 states and the District of Columbia in the fourth quarter of 2020, as real GDP for the nation increased at an annual rate of 4.3 percent. The percent change in real GDP in the fourth quarter ranged from 9.9 percent in South Dakota to 1.2 percent in the District of Columbia.