BEA 23-46
Scheduled Date
October 4 08:30:am
Release Title
Personal Consumption Expenditures by State, 2022

An official website of the United States government
|
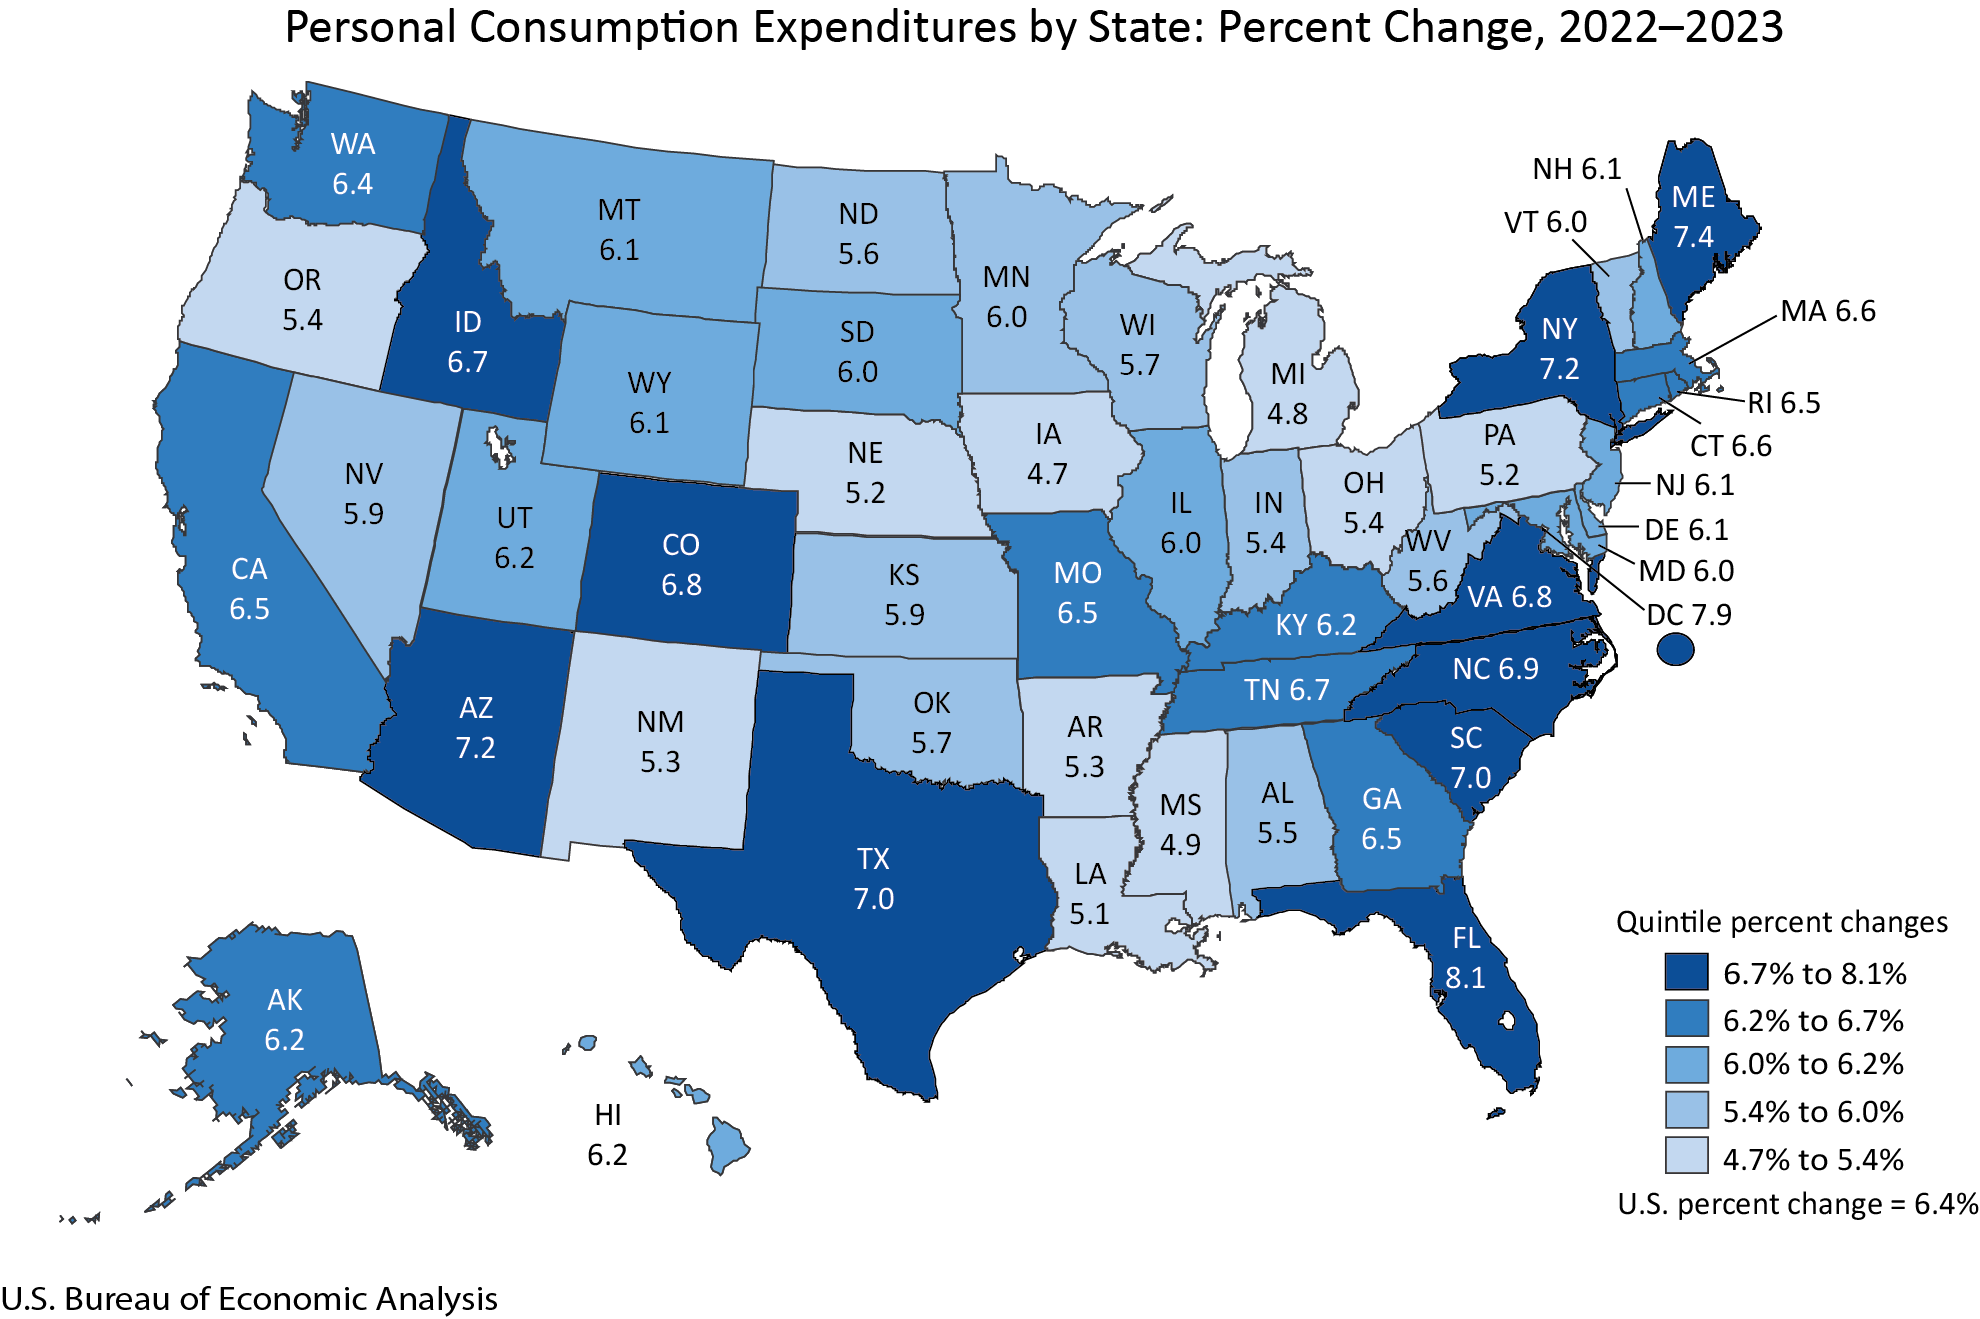
US PCE growth
|
+6.4%
|
Personal consumption expenditures (PCE) increased in all 50 states and the District of Columbia in 2023. The percent change ranged from 8.1 percent in Florida to 4.7 percent in Iowa. Nationally, current-dollar PCE increased 6.4 percent in 2023 after increasing 9.8 percent in 2022.
|
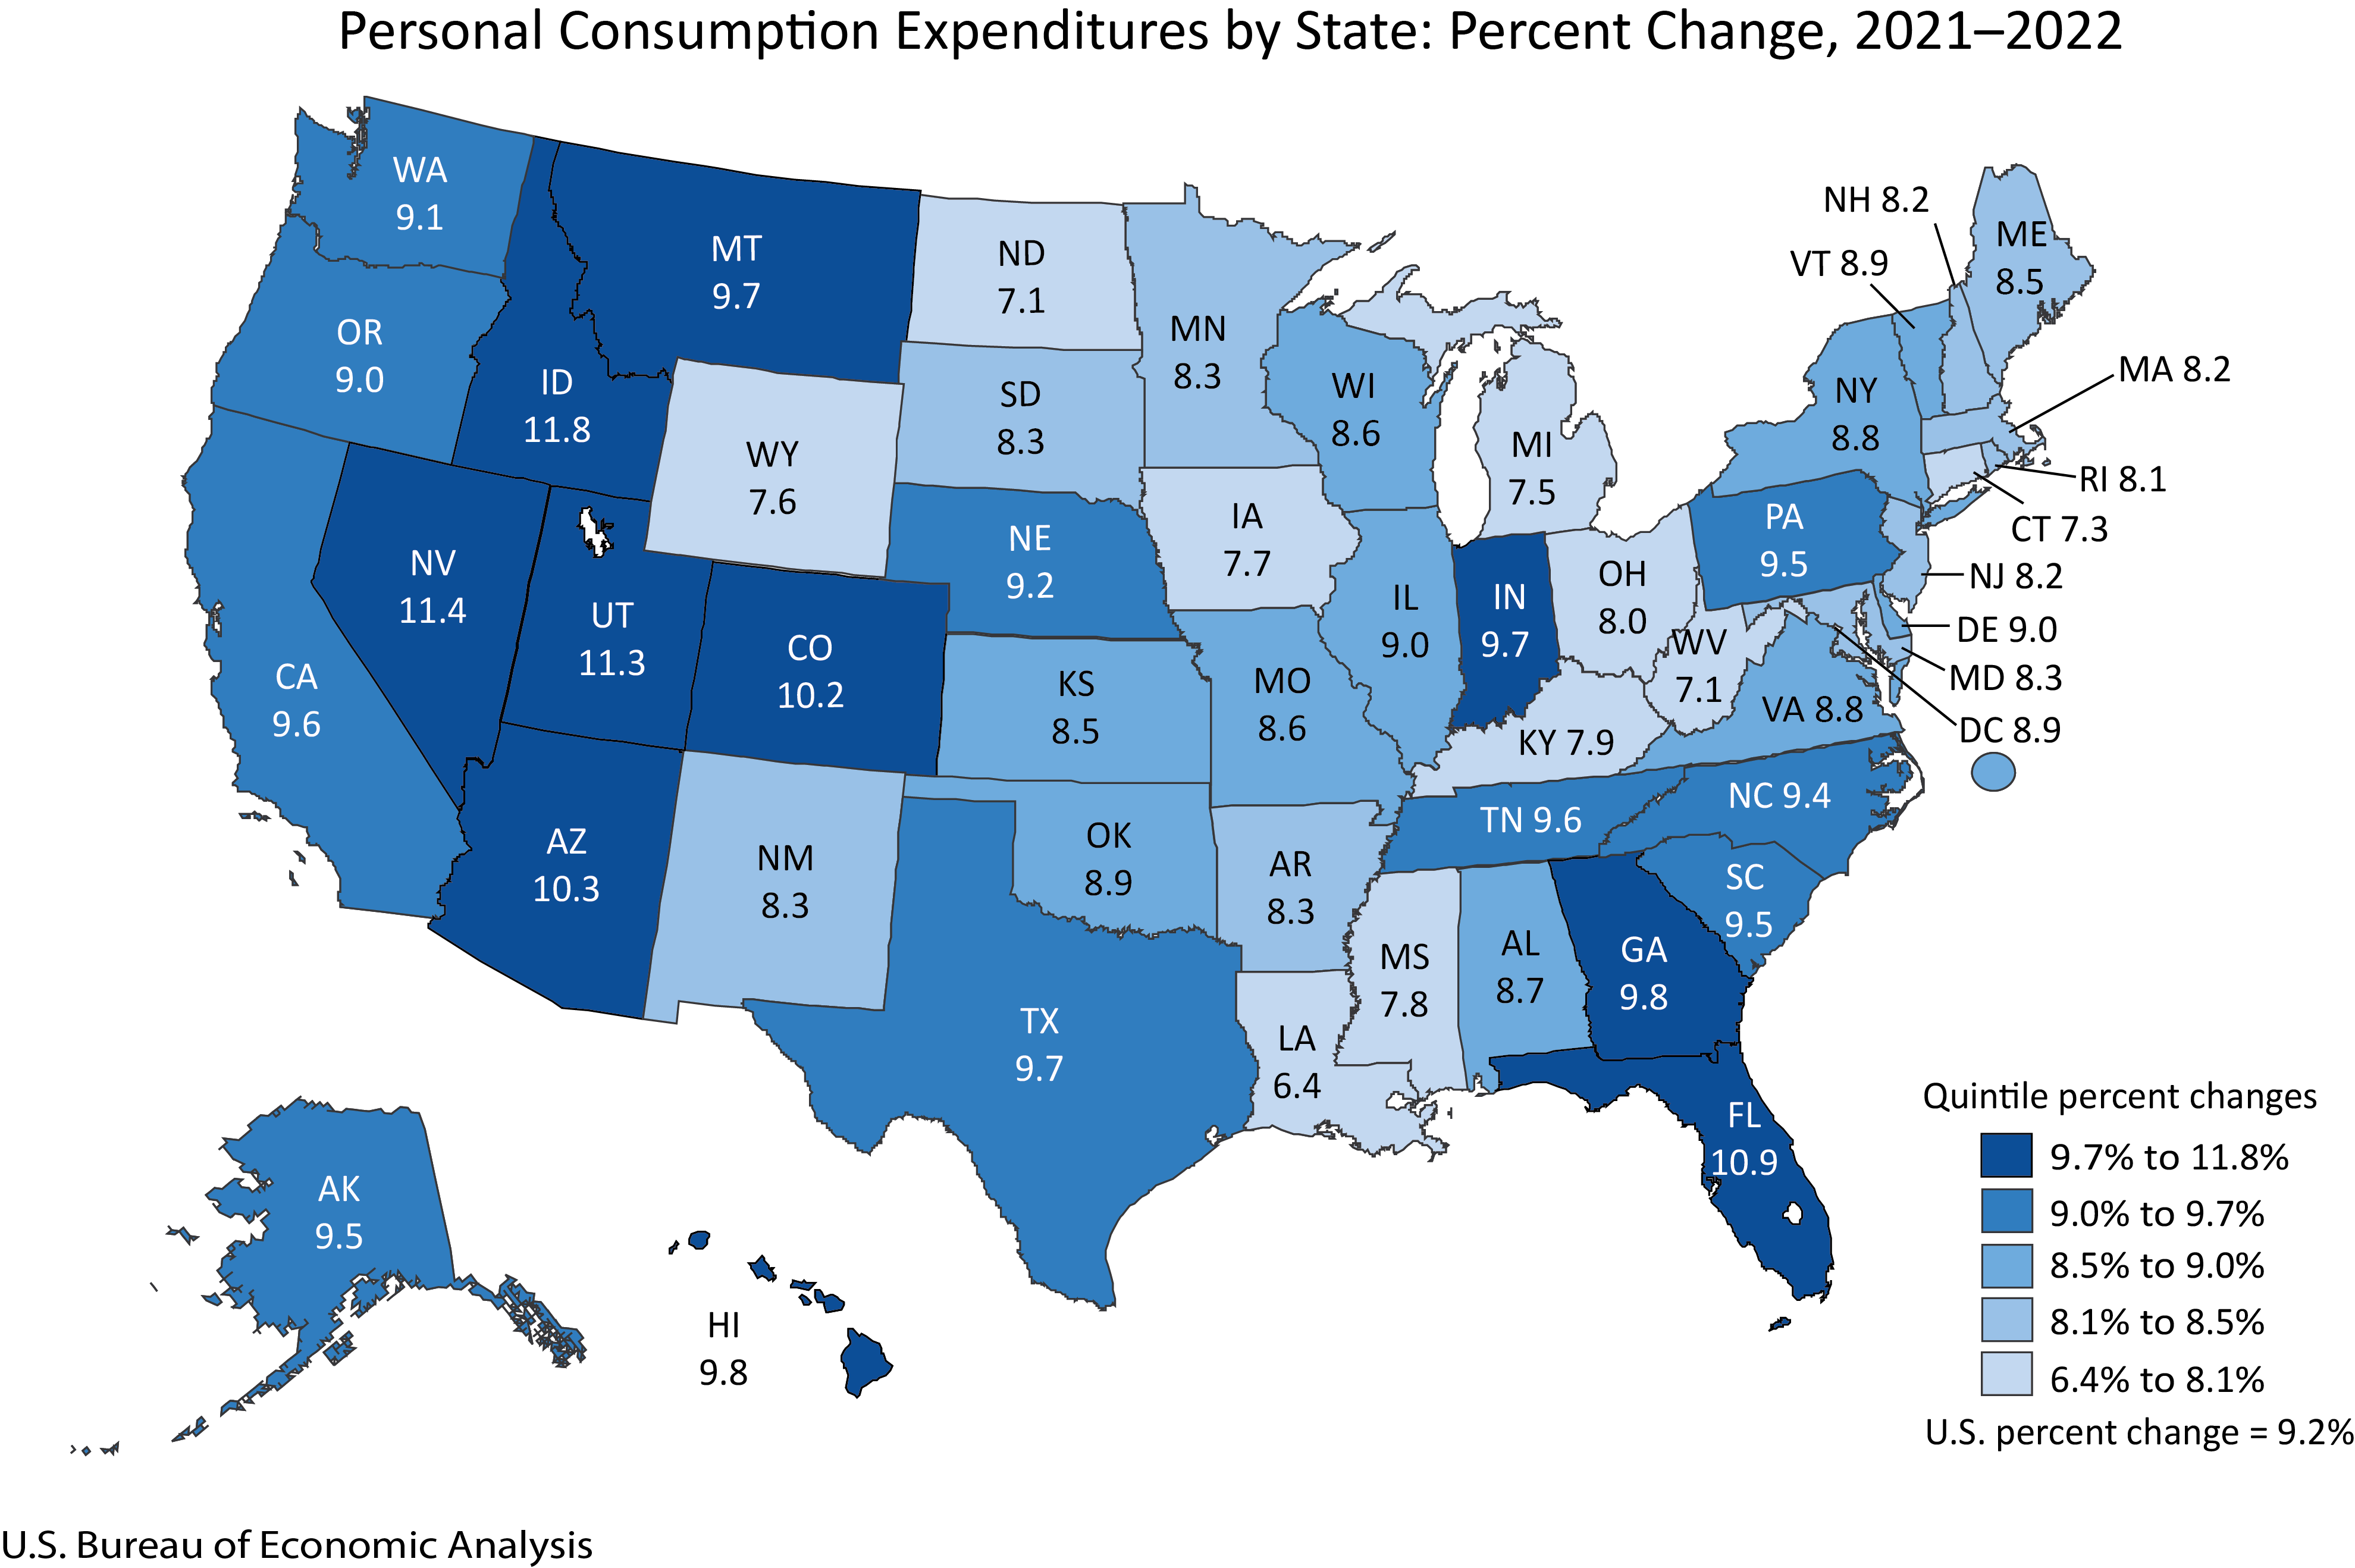
US PCE growth
|
+9.2%
|
Nationally, personal consumption expenditures (PCE), in current dollars, increased 9.2 percent in 2022 after increasing 12.9 percent in 2021. PCE increased in all 50 states and the District of Columbia, with the percent change ranging from 11.8 percent in Idaho to 6.4 percent in Louisiana.
|
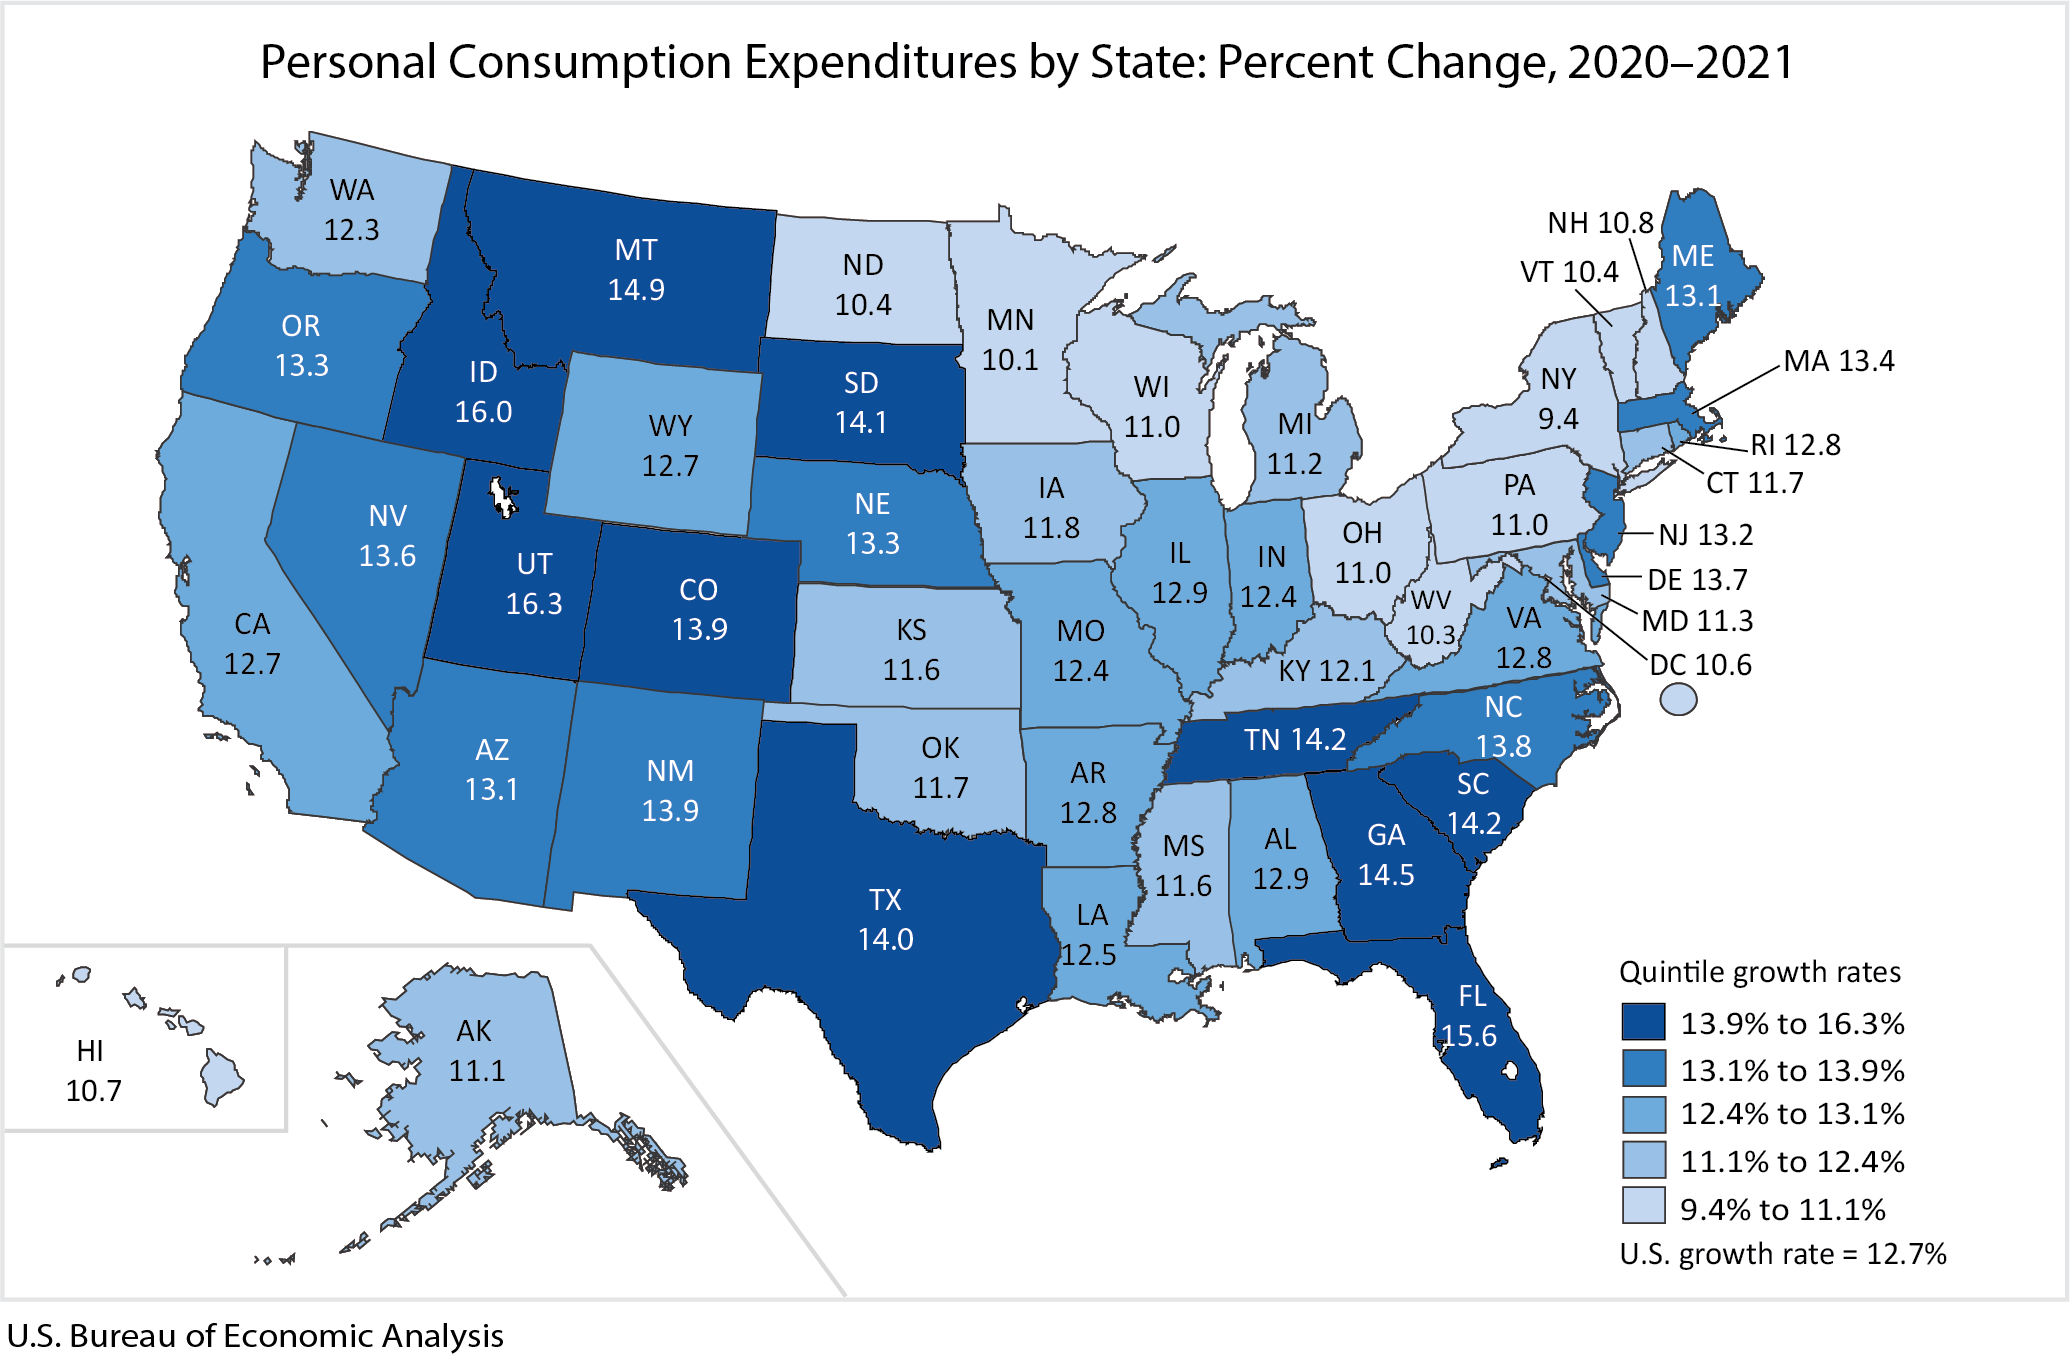
US PCE growth
|
+12.7%
|
State personal consumption expenditures (PCE) increased 12.7 percent in 2021 after decreasing 1.9 percent in 2020. The percent change in PCE across all 50 states and the District of Columbia ranged from 16.3 percent in Utah to 9.4 percent in New York.
|
US PCE growth
|
-2.6%
|
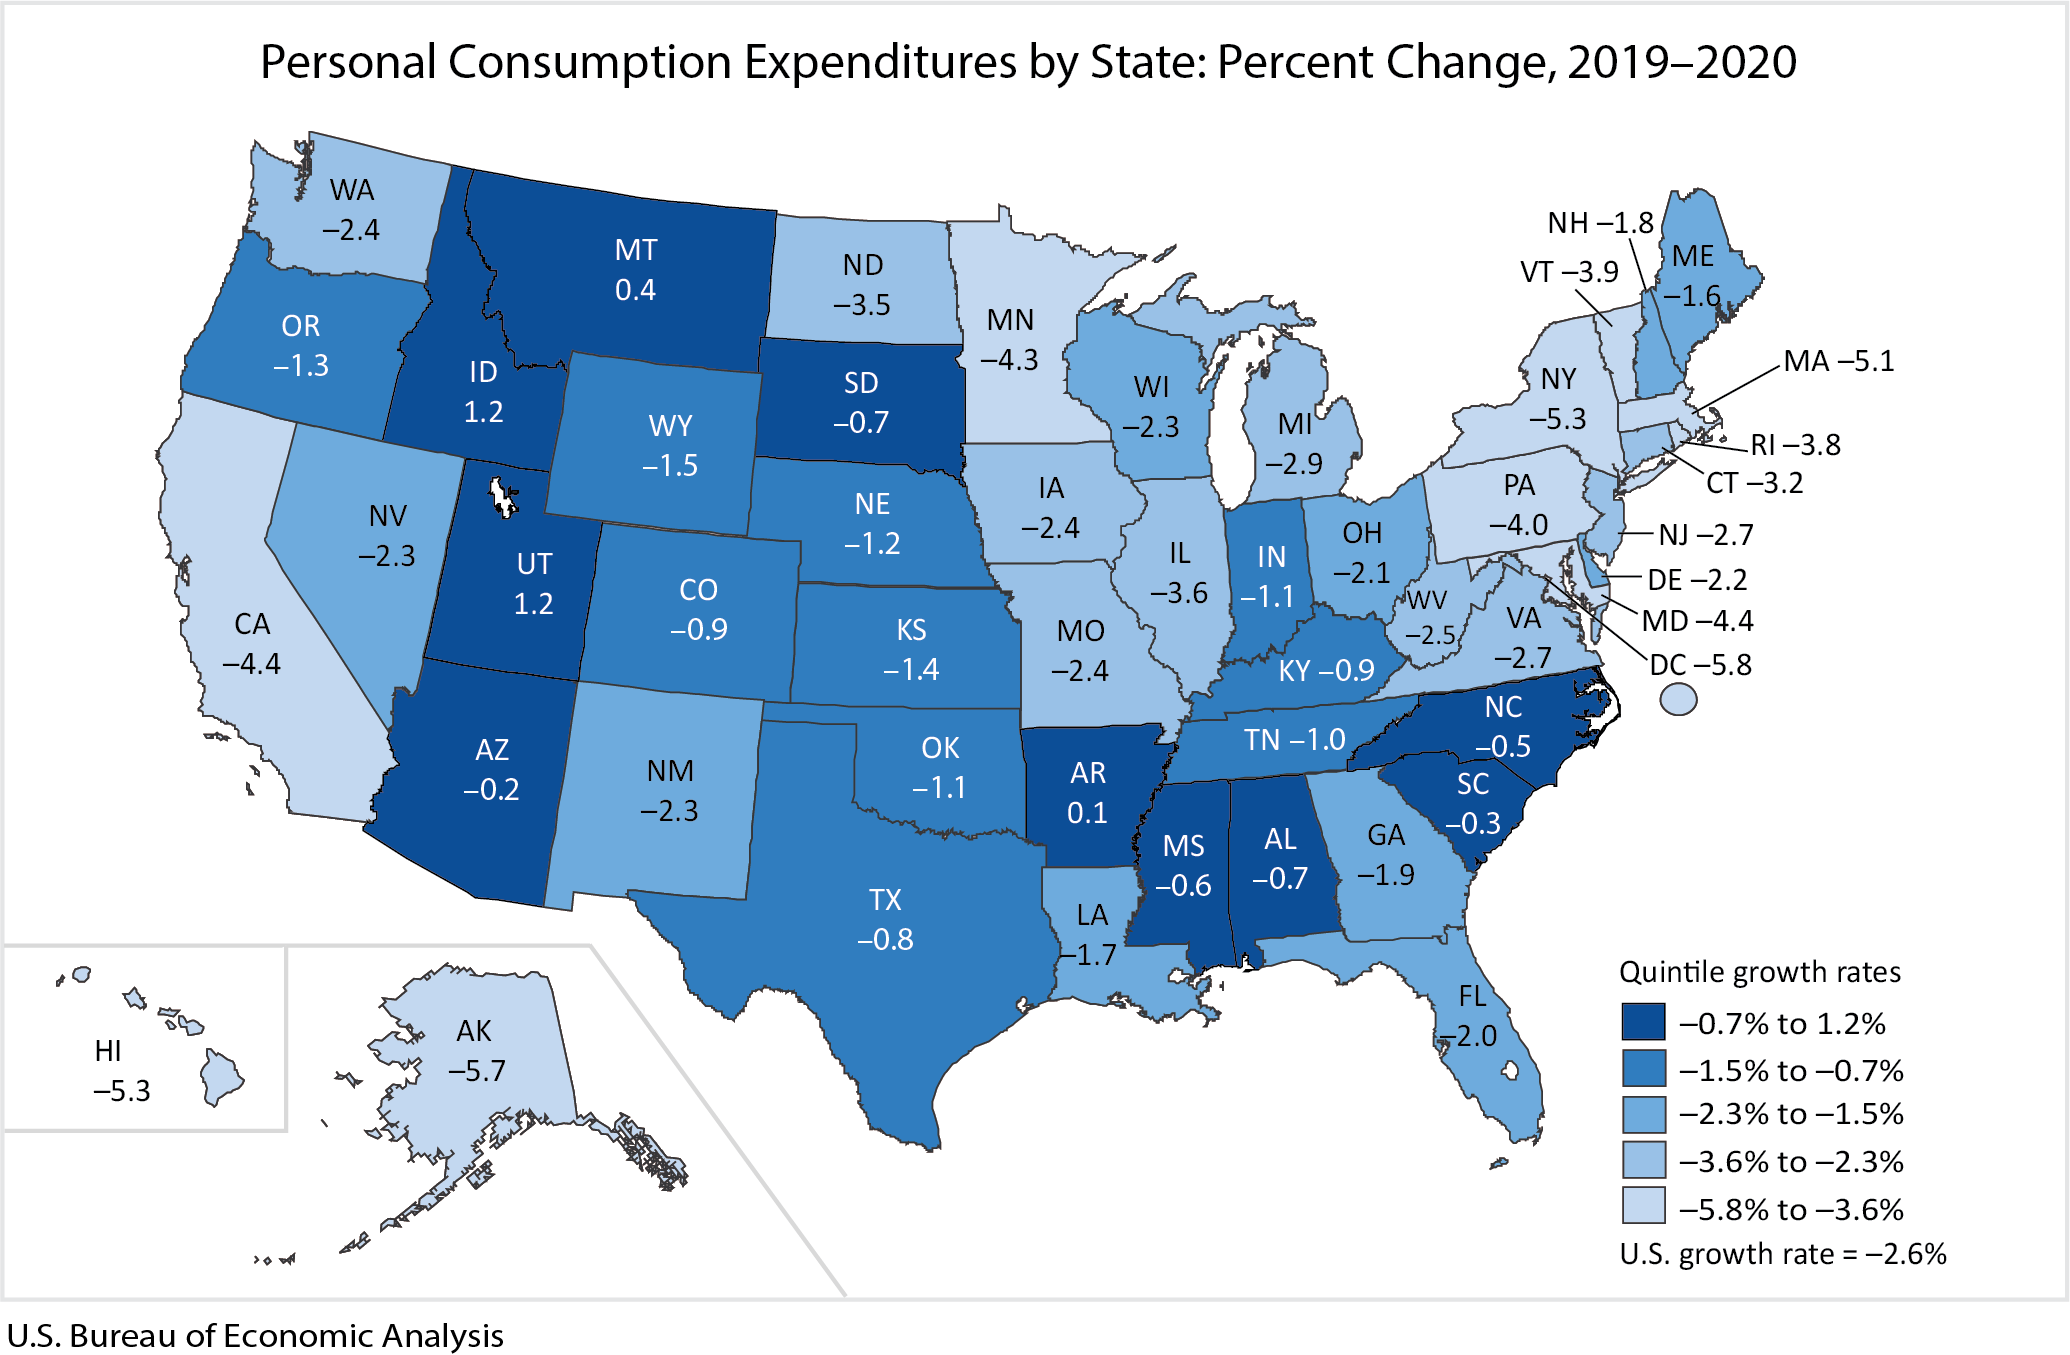
State personal consumption expenditures (PCE) decreased 2.6 percent in 2020 after increasing 3.7 percent in 2019. The percent change in PCE across all 50 states and the District of Columbia ranged from 1.2 percent in Idaho and Utah to –5.8 percent in the District of Columbia.
|
US PCE growth
|
3.9%
|
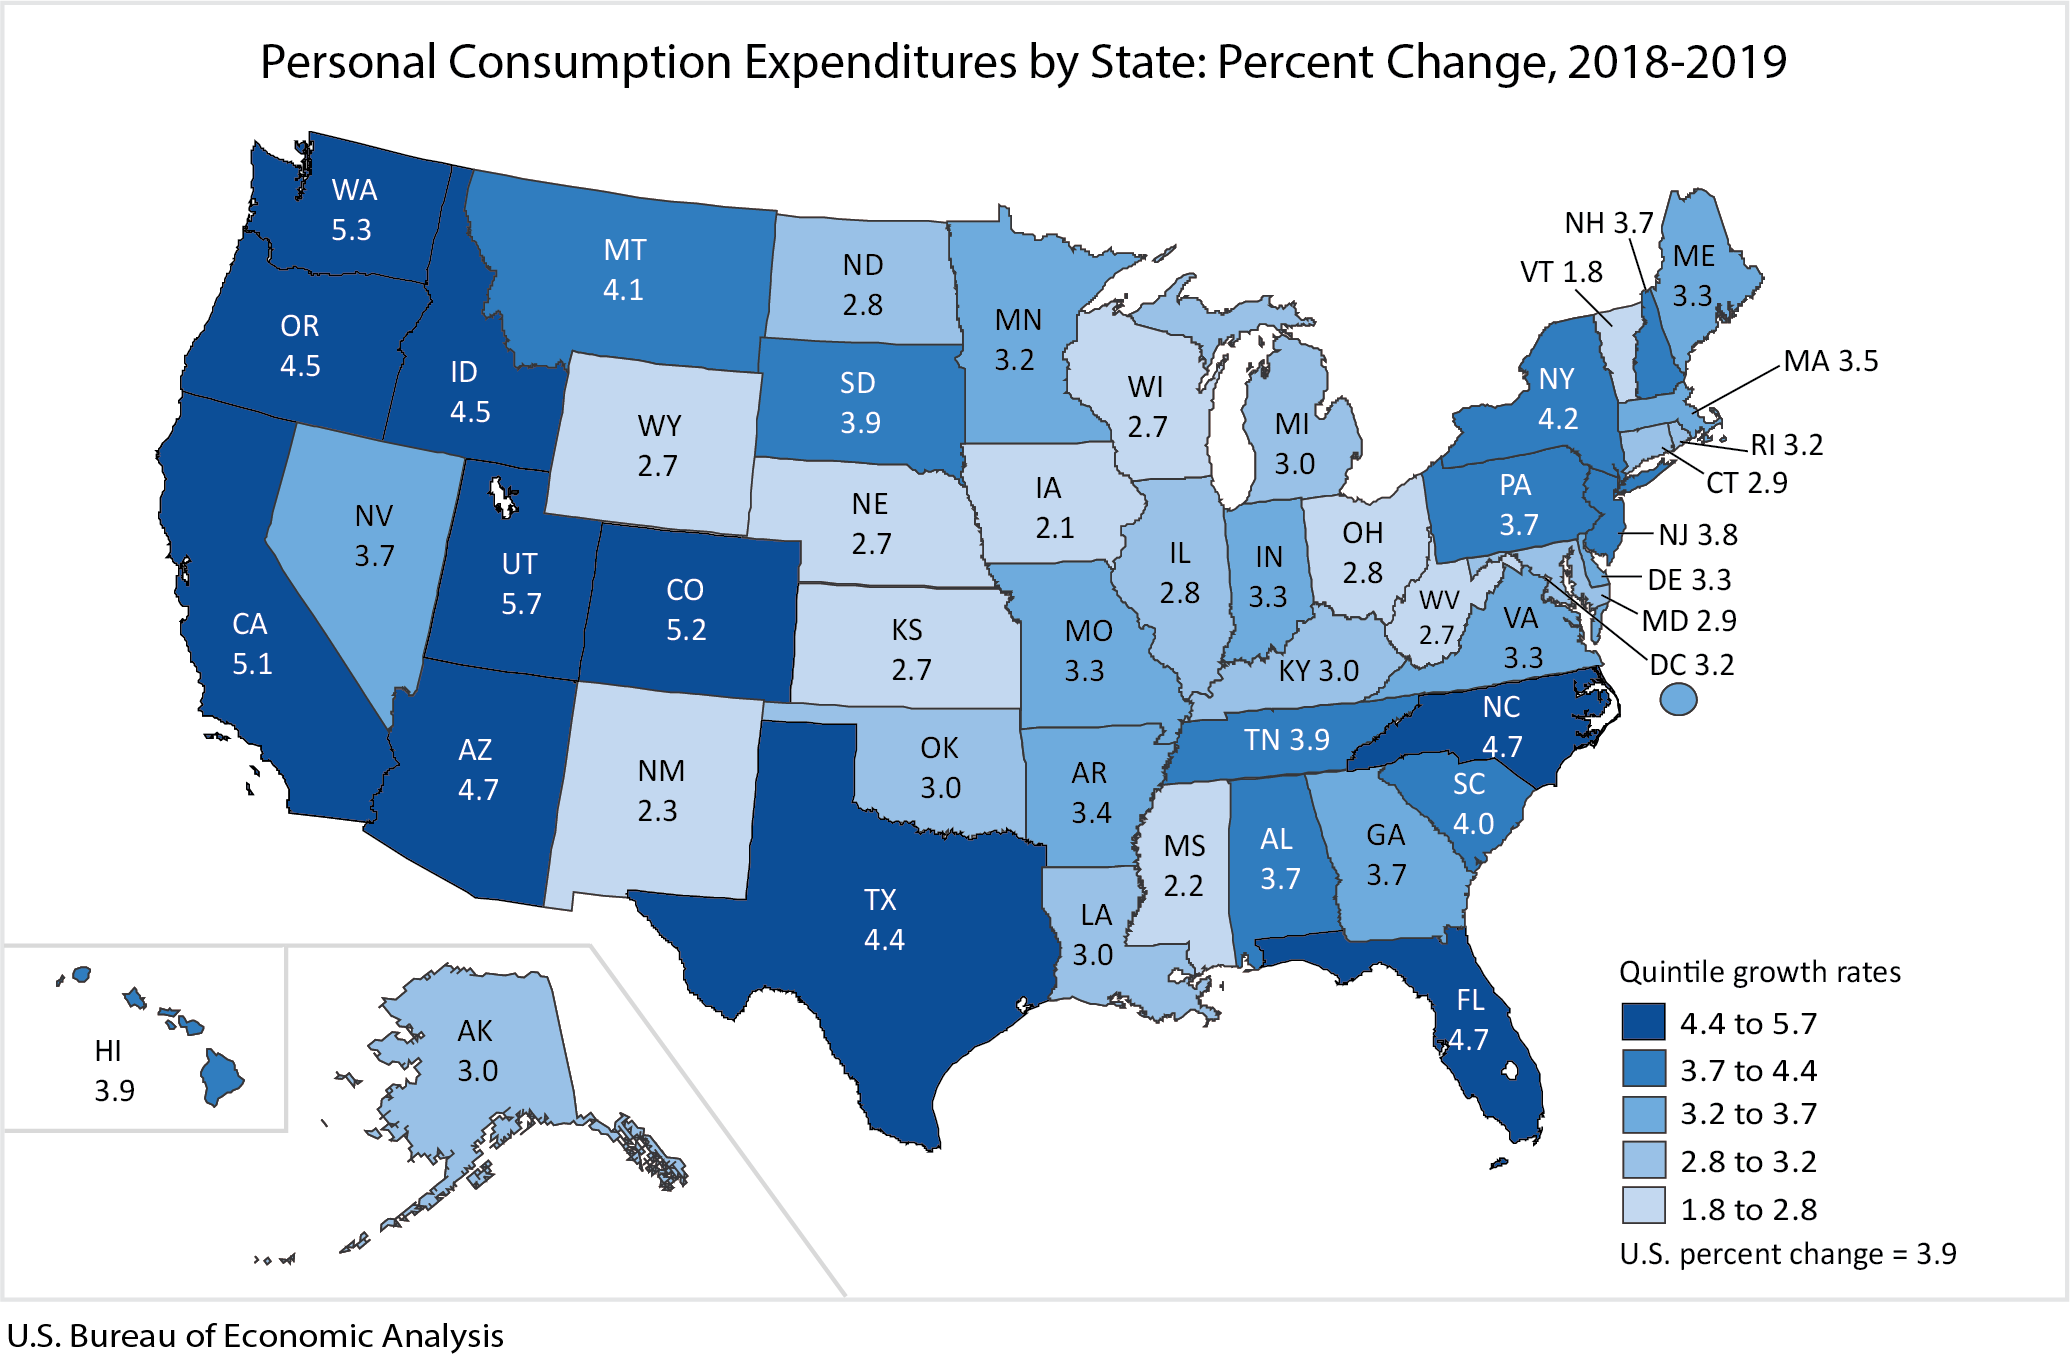
State personal consumption expenditures (PCE) increased 3.9 percent in 2019, a deceleration from the 4.9 percent increase in 2018. The percent change in PCE across all states ranged from 5.7 percent in Utah to 1.8 percent in Vermont.
|
Average State PCE Growth (2018)
|
5.1%
|
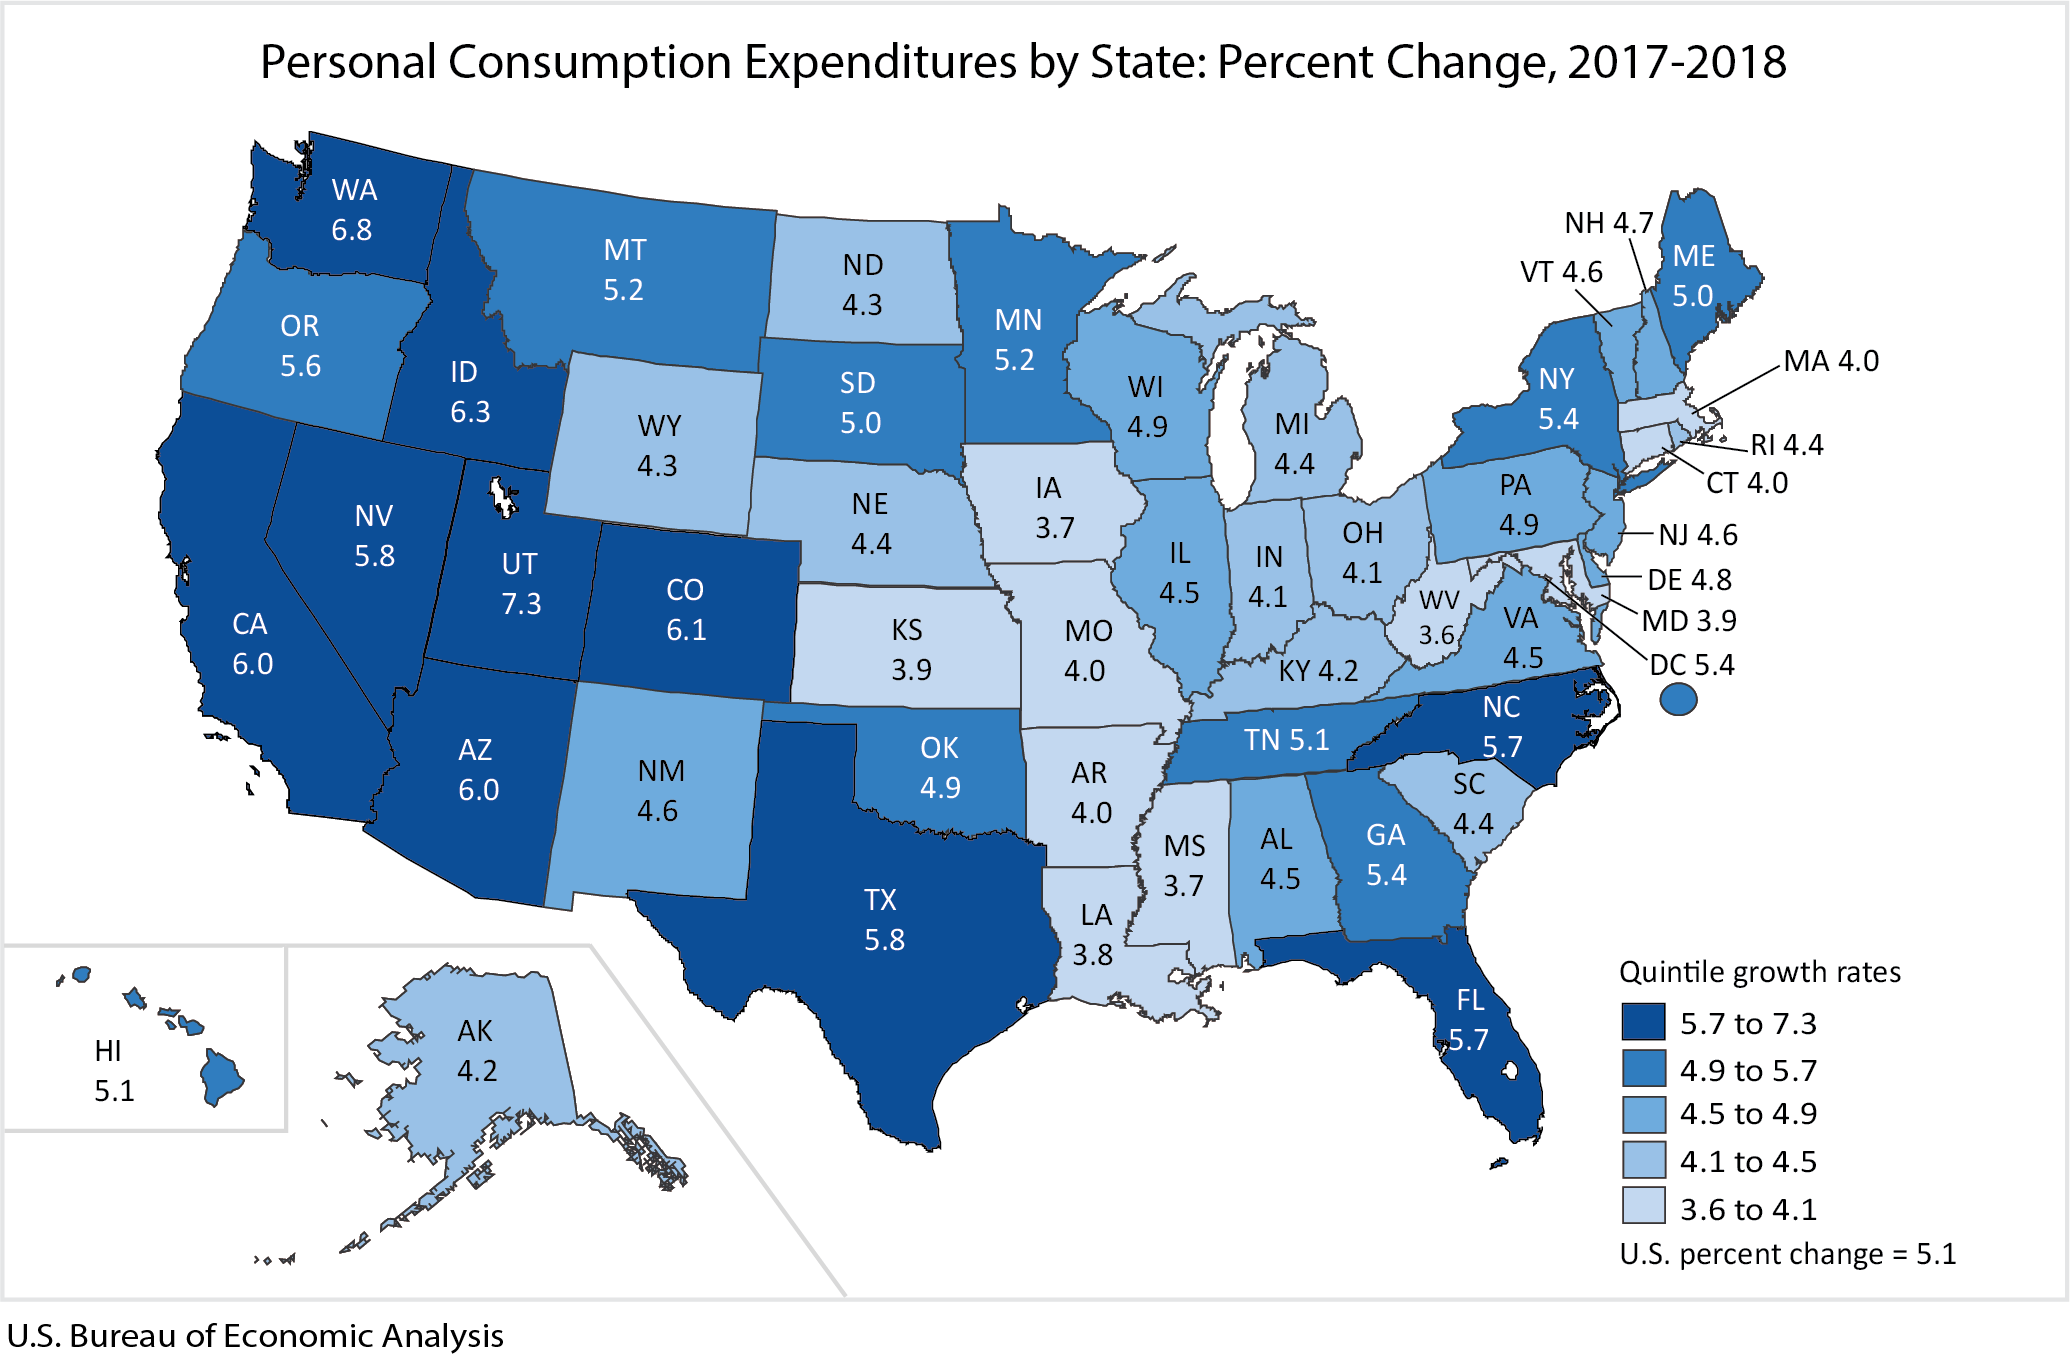
State personal consumption expenditures (PCE) increased 5.1 percent in 2018, an acceleration from the 4.4 percent increase in 2017. The percent change in PCE across all states ranged from 7.3 percent in Utah to 3.6 percent in West Virginia.
|
Average State PCE Growth (2017)
|
4.3%
|
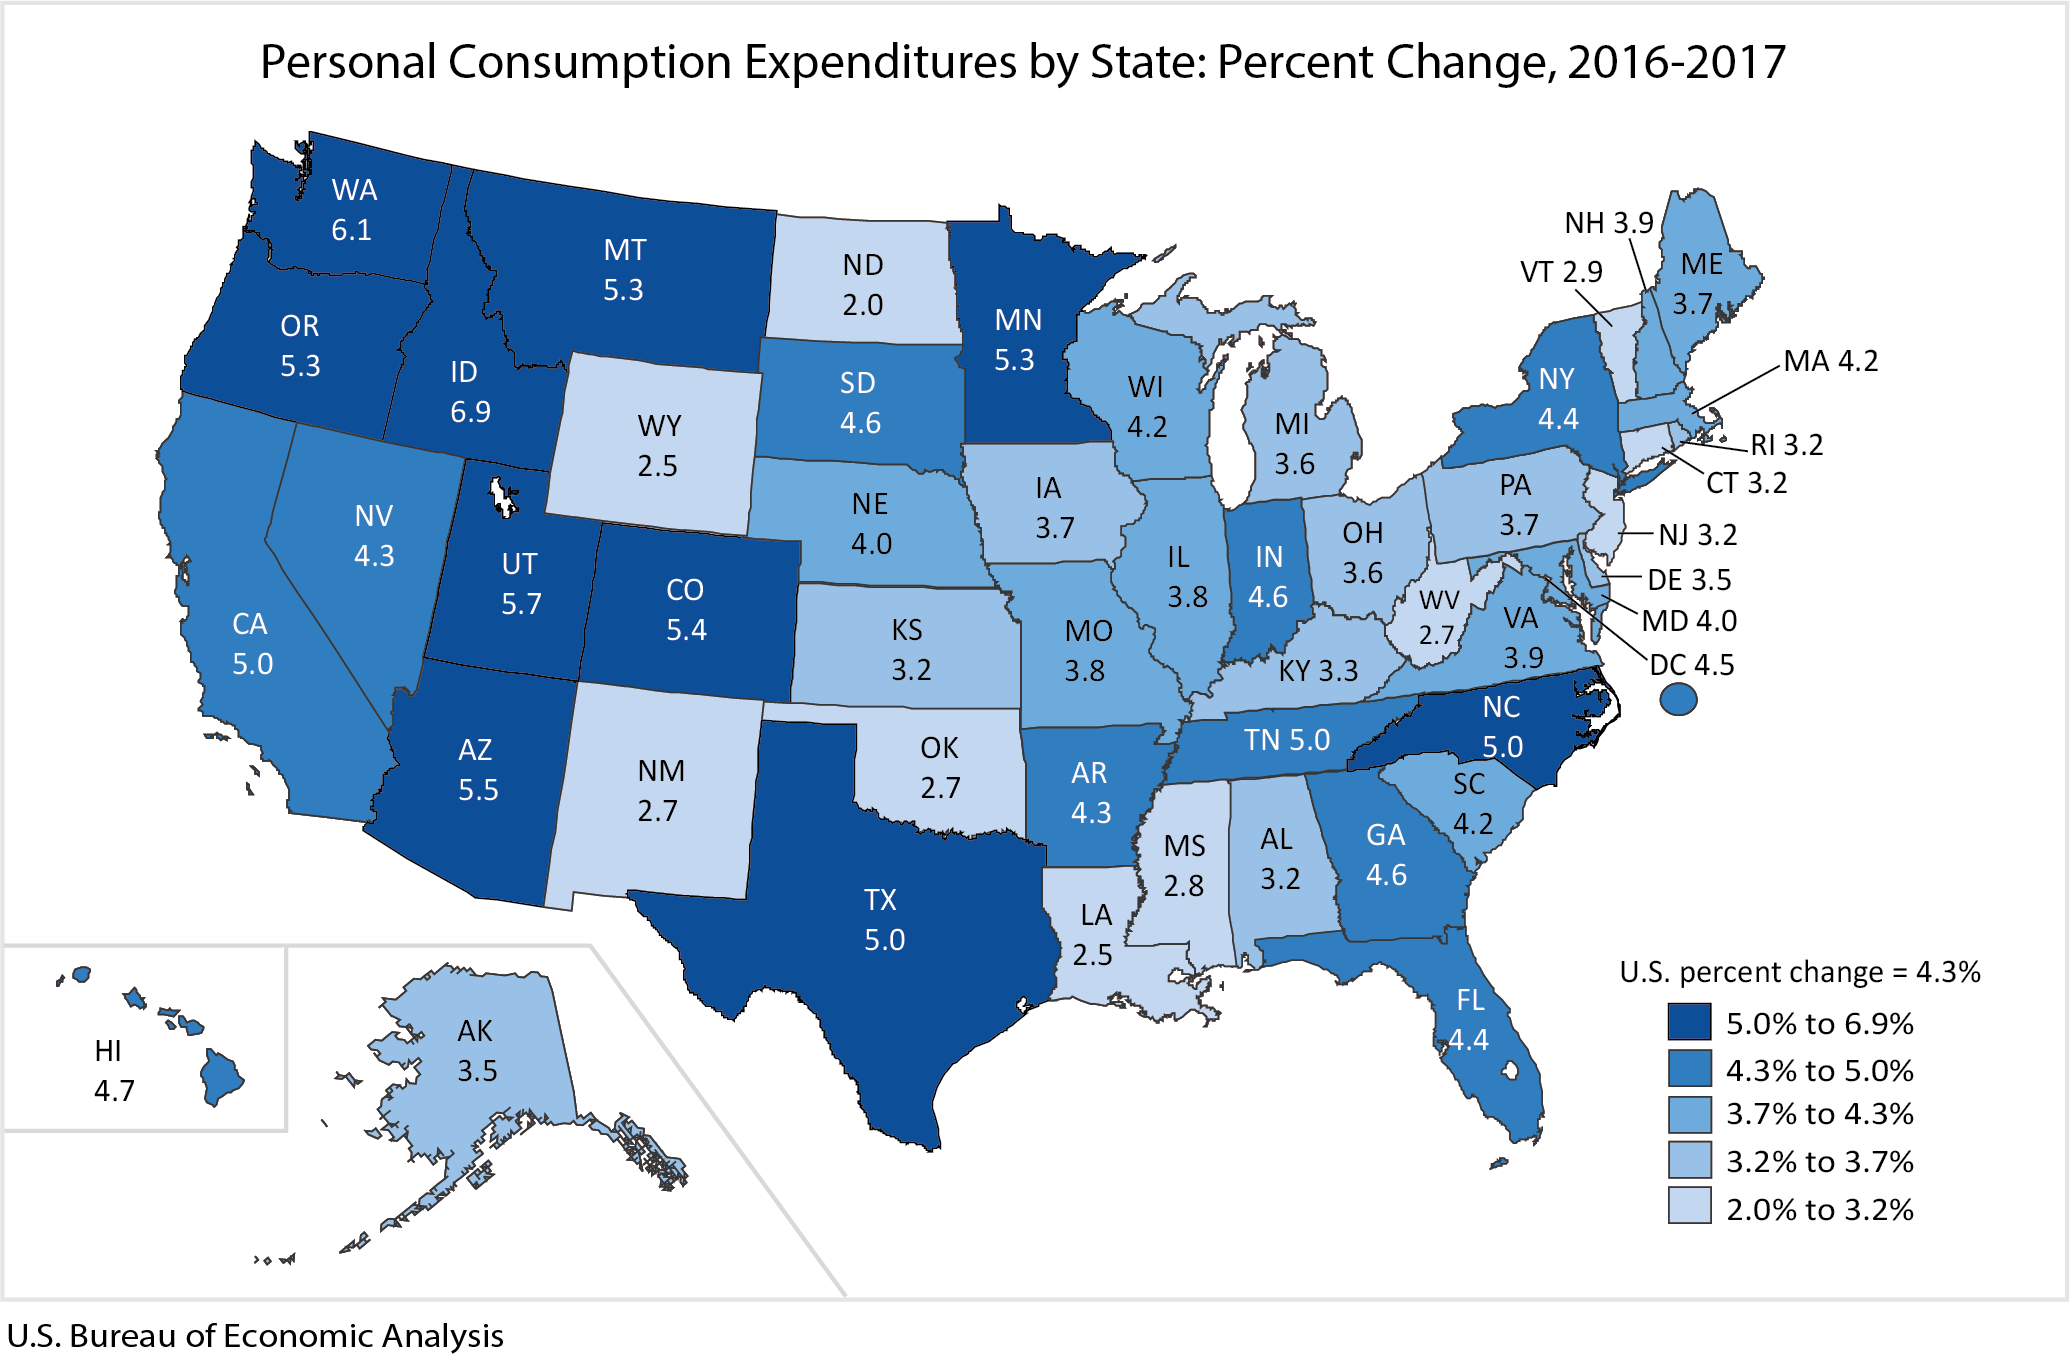
State personal consumption expenditures (PCE) increased on average 4.3 percent in 2017, an acceleration from the 3.8 percent increase in 2016. The percent change in PCE across all states ranged from 6.9 percent in Idaho to 2.0 percent in North Dakota.