BEA 26-42
Scheduled Date
December 2 08:30:am
Release Title
GDP by County and Personal Income by County, 2025

An official website of the United States government
Real gross domestic product (GDP) increased in 2,273 counties, decreased in 809 counties, and was unchanged in 24 counties in 2024. County-level changes ranged from a 76.6 percent increase in Carter County, MT, to a 46.3 percent decline in Baca County, CO.
Personal income, in current dollars, increased in 2,768 counties, decreased in 331, and was unchanged in 7 counties in 2024. County-level changes ranged from a 22.6 percent increase in Harding County, SD, to a 23.3 percent decline in Issaquena County, MS.
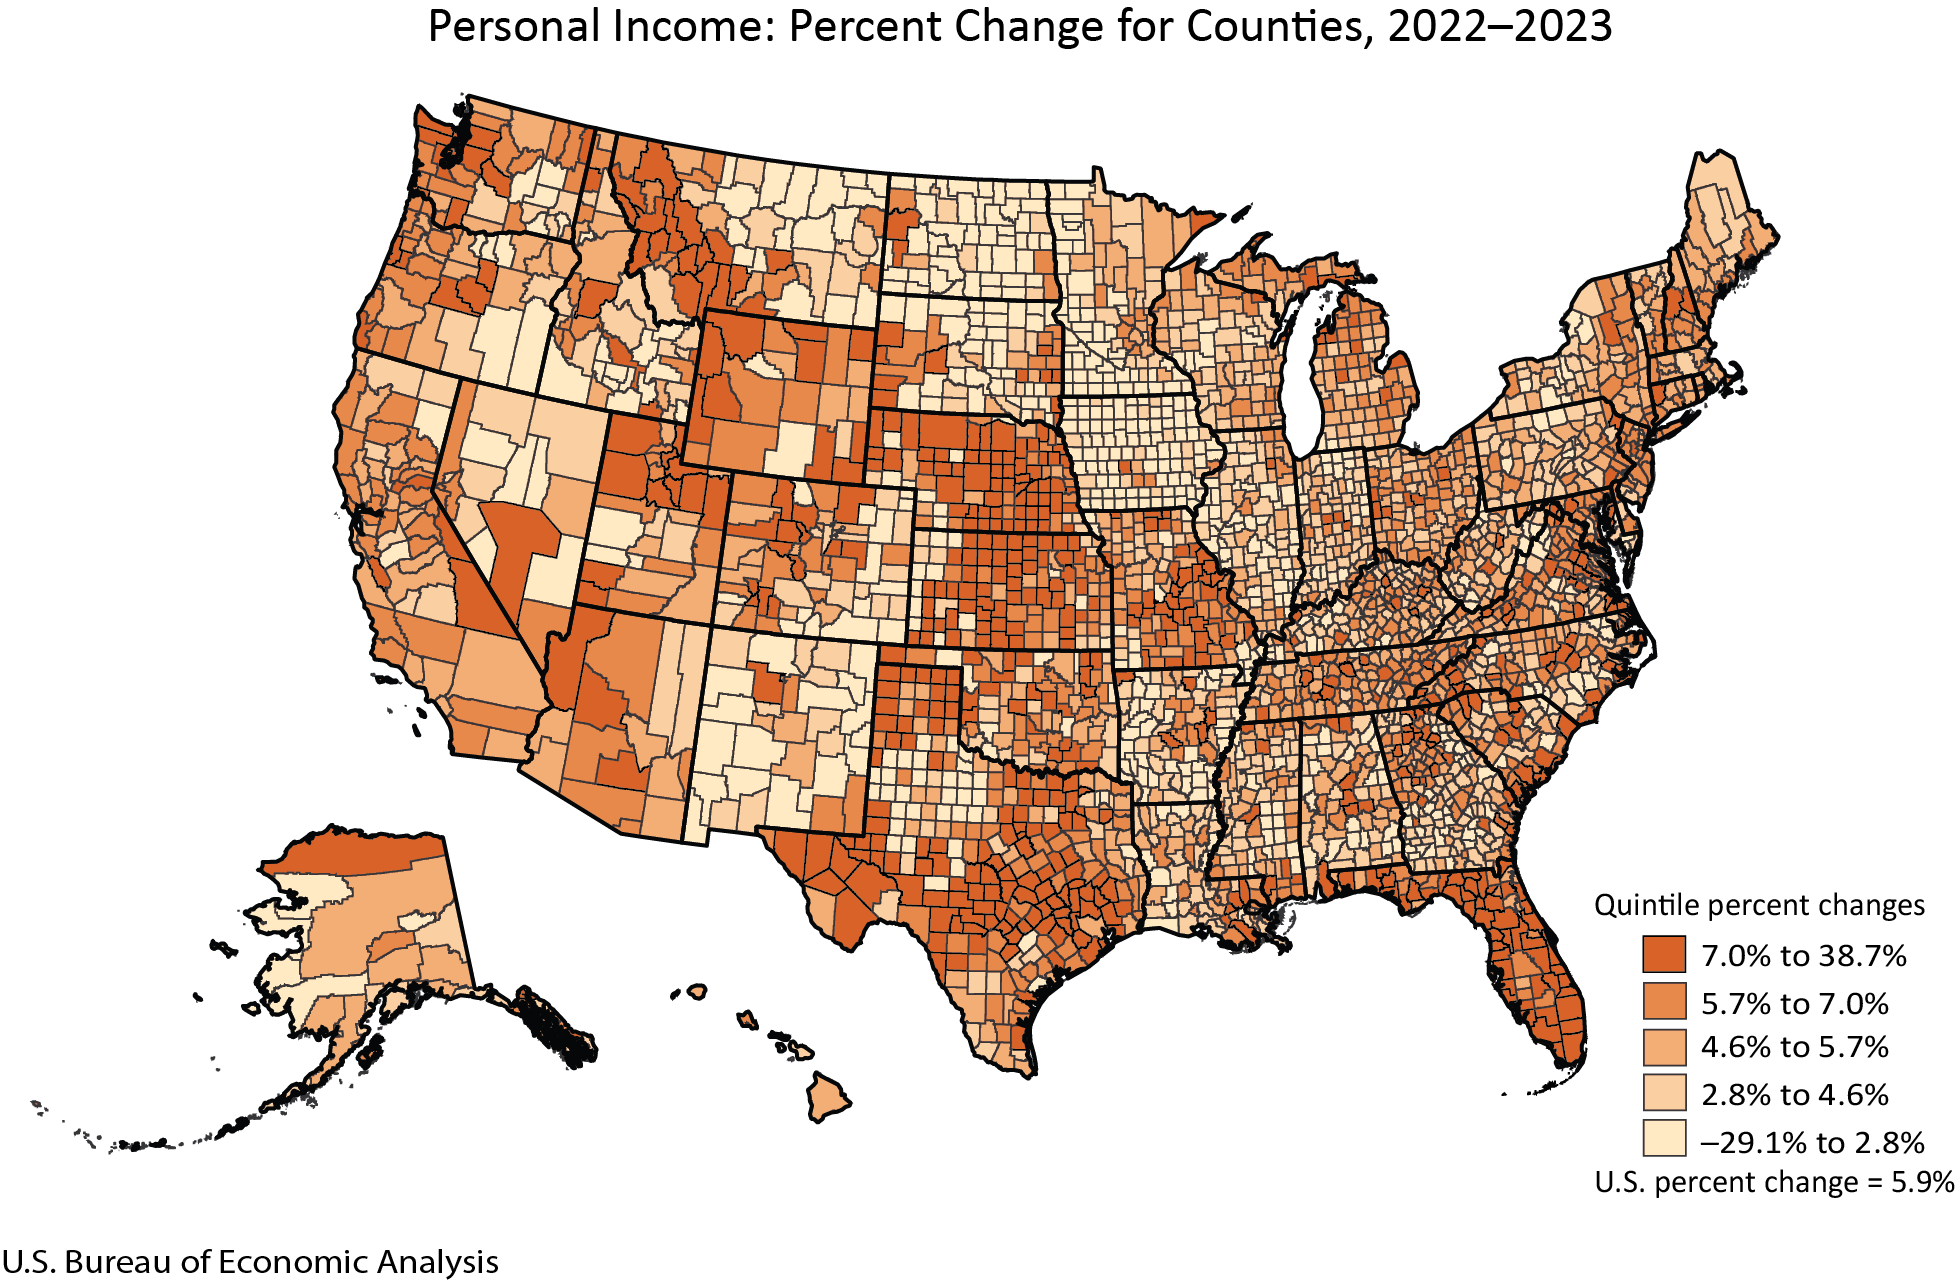
In 2023, personal income, in current dollars, increased in 2,814 counties, decreased in 295, and was unchanged in five counties in 2023. Personal income increased 6.0 percent in the metropolitan portion of the United States and 4.7 percent in the nonmetropolitan portion.
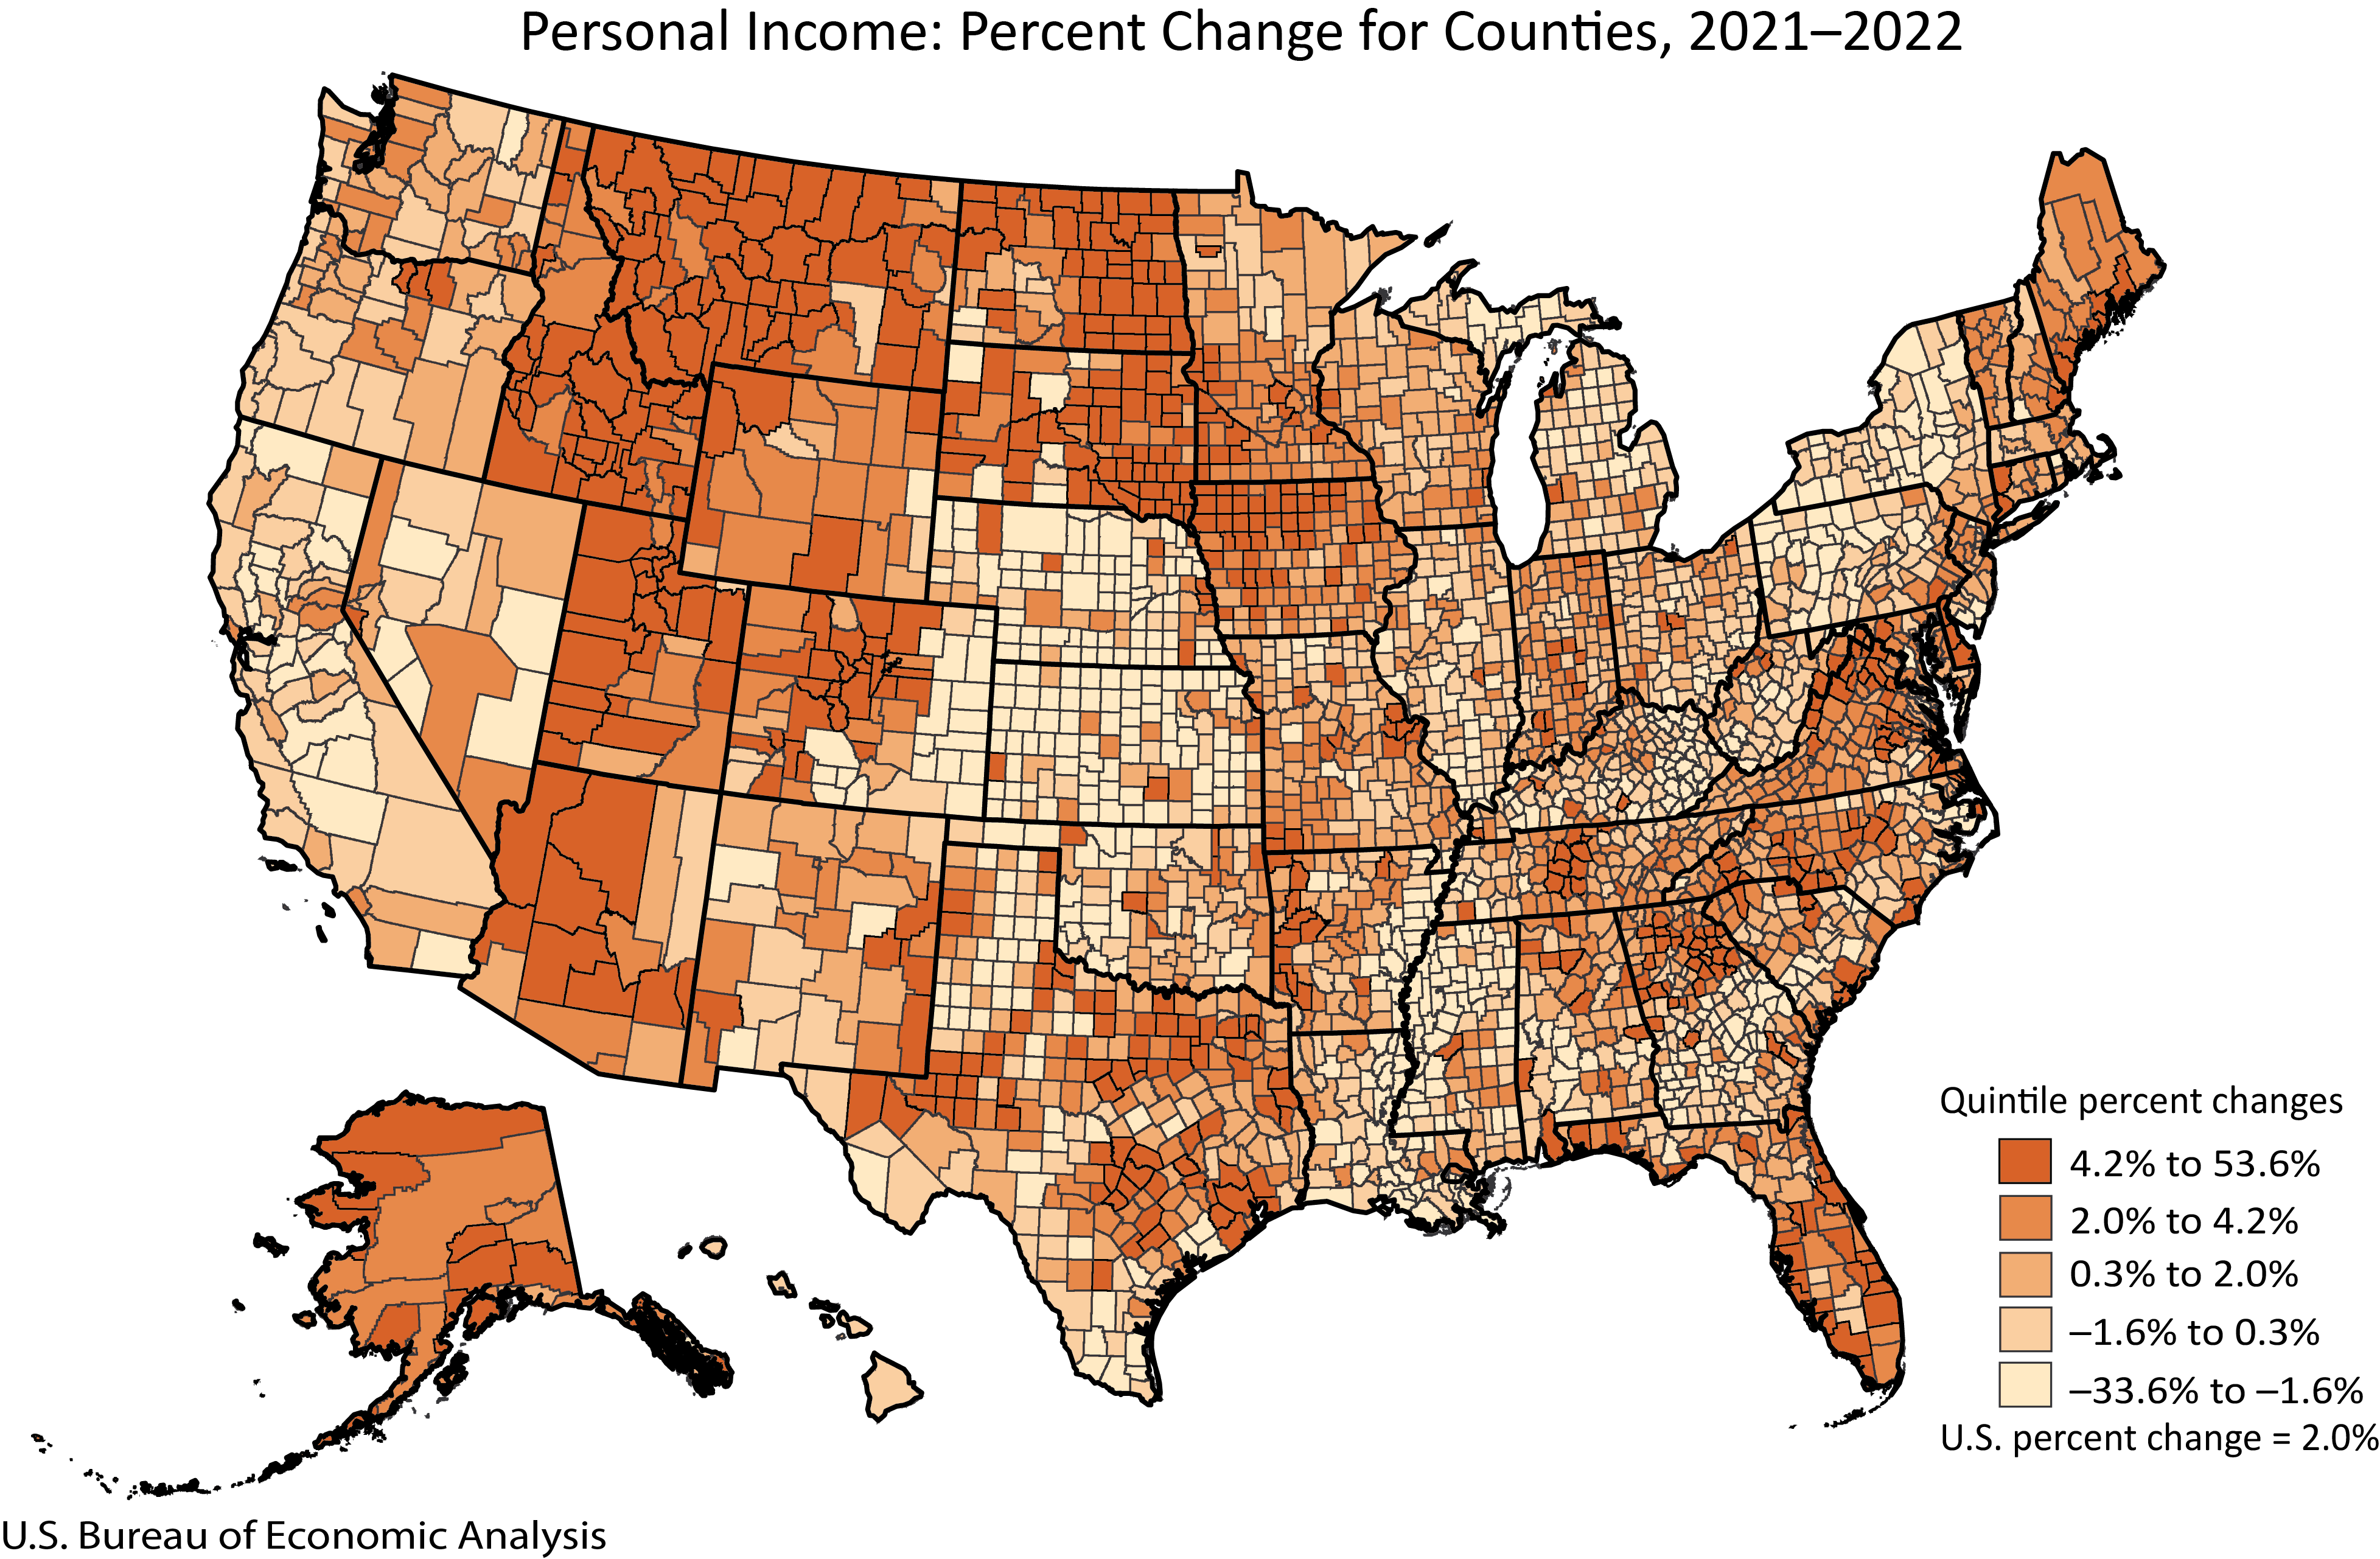
In 2022, personal income, in current dollars, increased in 1,964 counties, decreased in 1,107, and was unchanged in 43. Personal income increased 2.1 percent in the metropolitan portion of the United States and 1.3 percent in the nonmetropolitan portion.
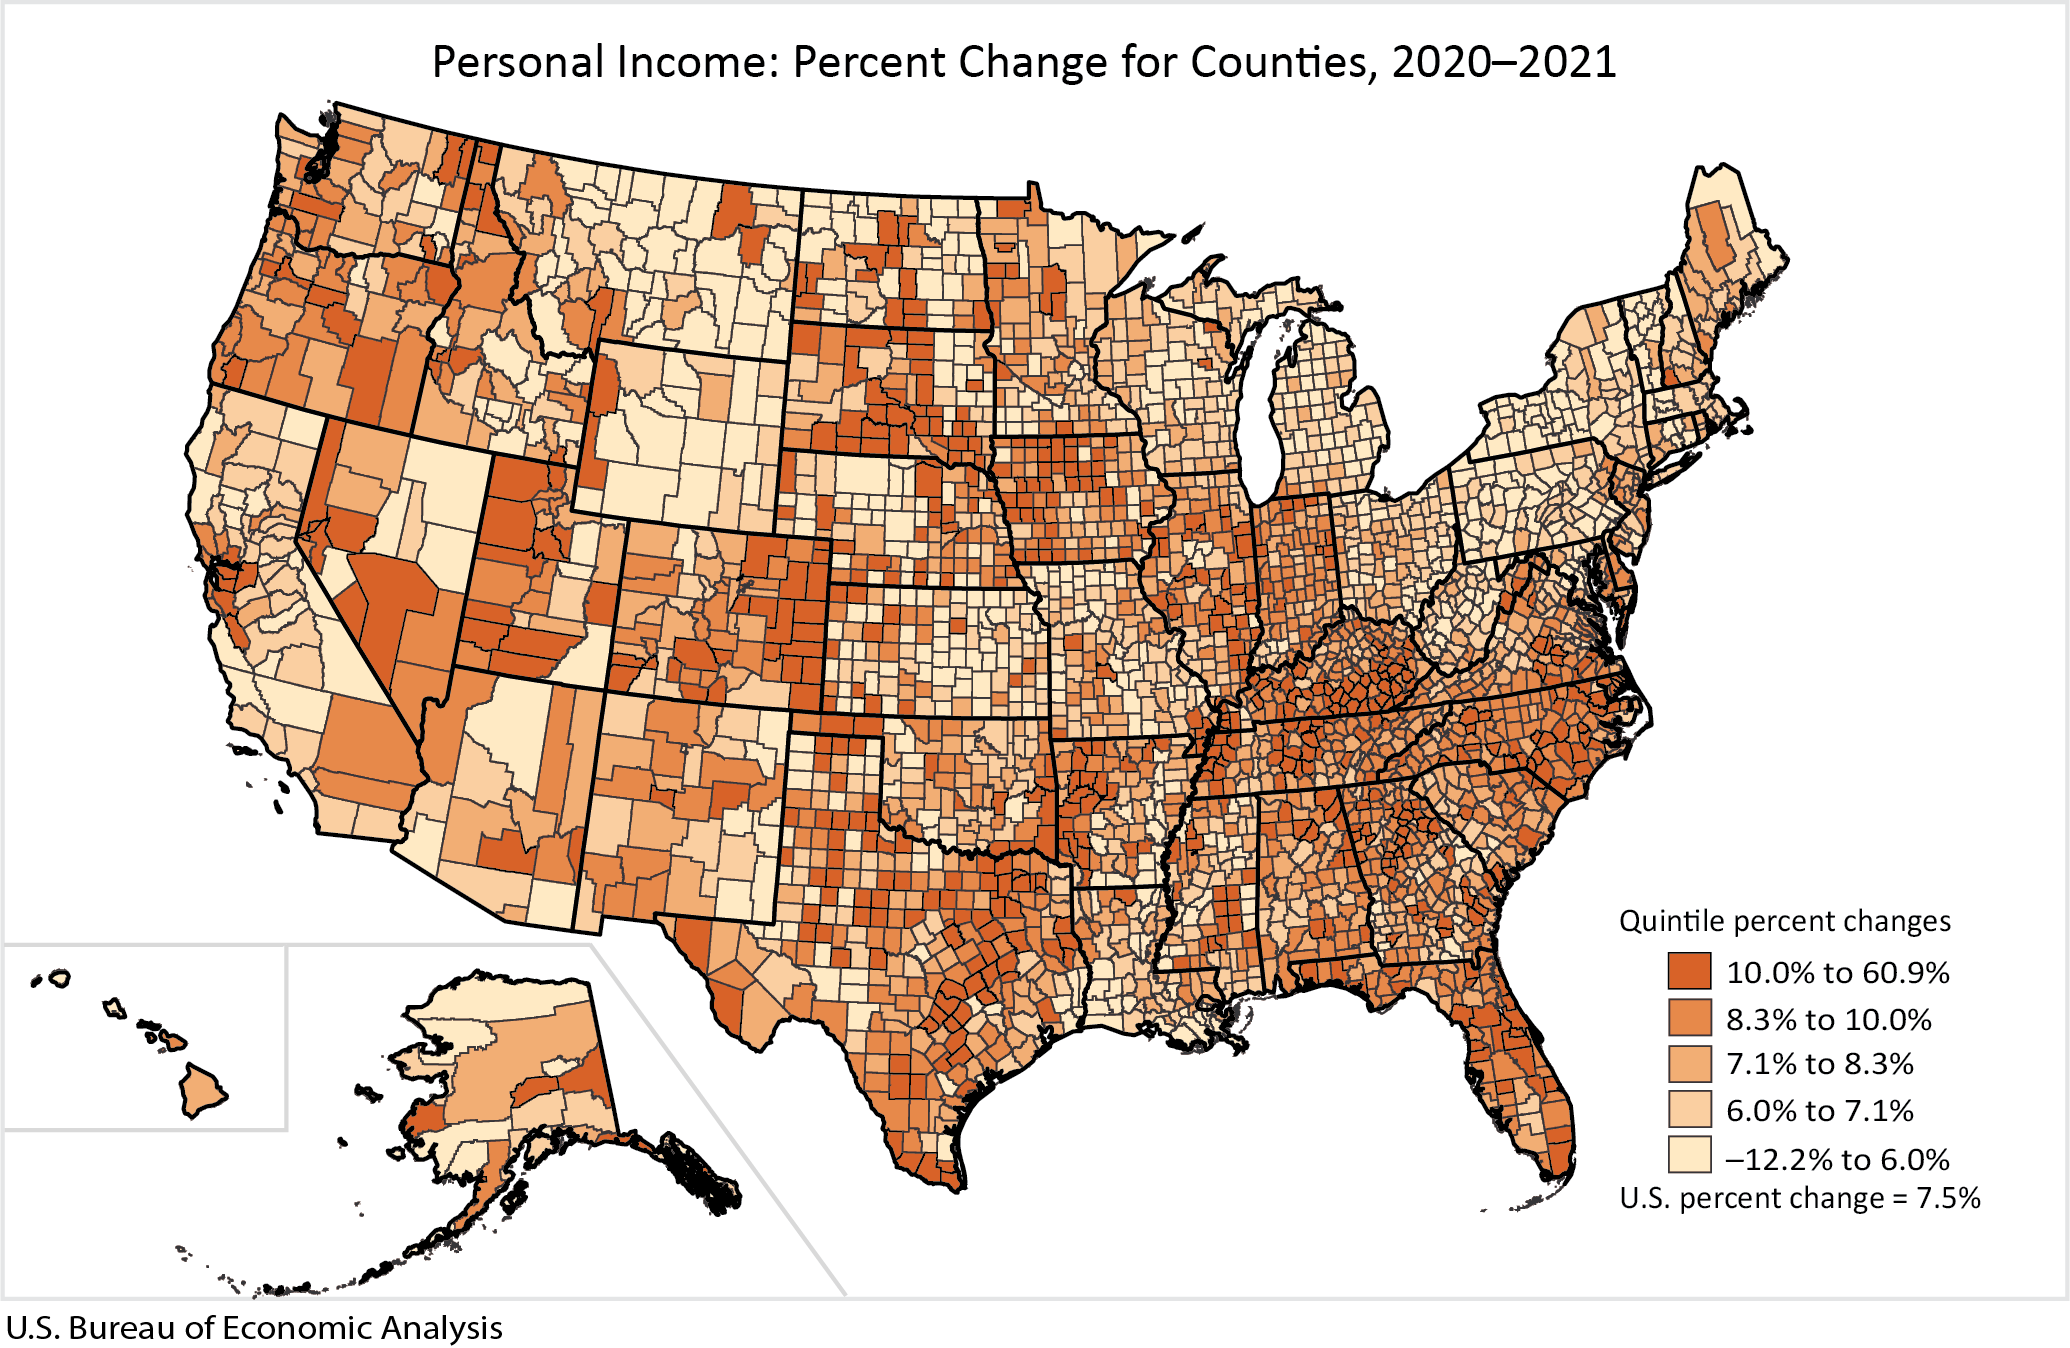
In 2021, personal income increased in 3,075 counties, decreased in 36, and was unchanged in 3. Personal income increased 7.4 percent in the metropolitan portion of the United States and 7.7 percent in the nonmetropolitan portion.
In 2020, personal income increased in 3,040 counties, decreased in 69, and was unchanged in 3. Personal income increased 6.4 percent in the metropolitan portion of the United States and increased 7.6 percent in the nonmetropolitan portion. Personal income estimates were impacted by the response to the spread of COVID-19, as governments issued and lifted “stay-at-home” orders. The full economic effects of the COVID-19 pandemic cannot be quantified in the local area personal income estimates, because the impacts are generally embedded in source data and cannot be separately identified.