Bureau of Economic Analysis
Direct Investment by Country and Industry, 2024
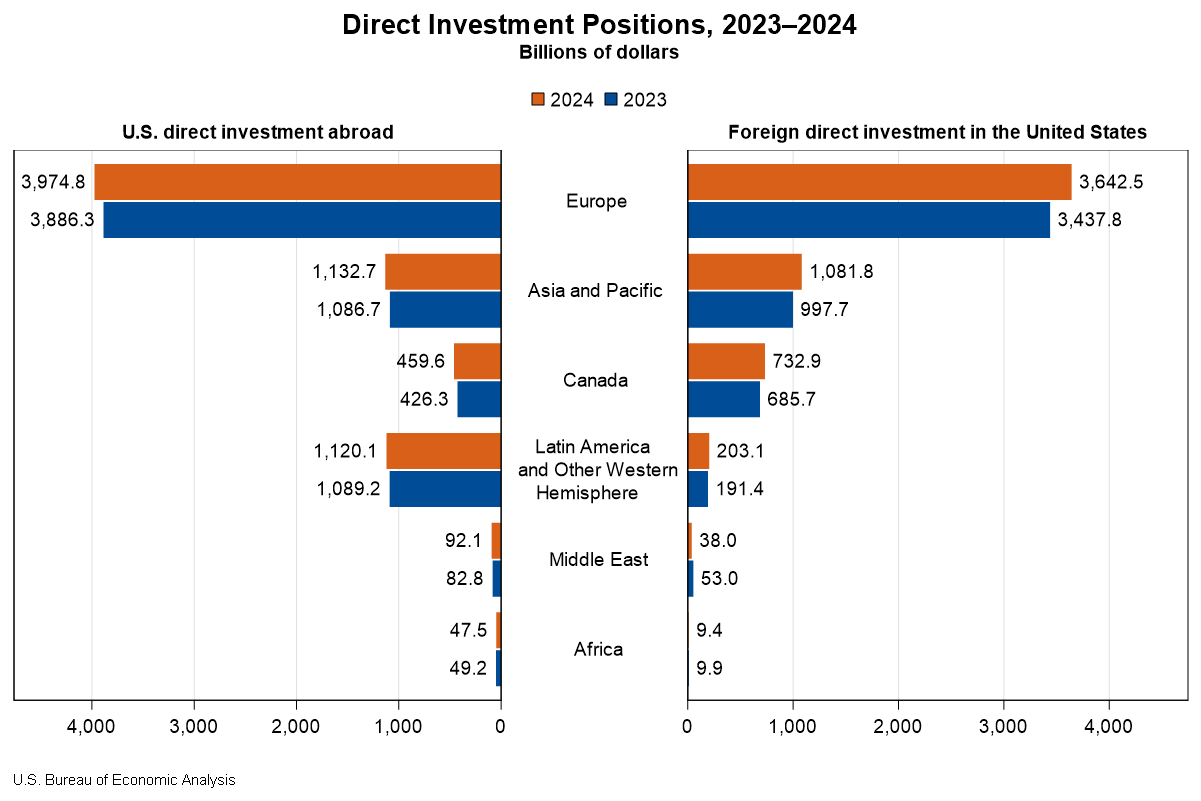
The U.S. direct investment abroad position, or cumulative level of investment, increased $206.3 billion to $6.83 trillion at the end of 2024, according to statistics released today by the U.S. Bureau of Economic Analysis. The increase was led by an $88.4 billion increase in the position in Europe, primarily in Luxembourg and Germany. By industry, manufacturing affiliates had the largest increase, led by manufacturing of computers and electronic products.
The foreign direct investment in the United States position increased $332.1 billion to $5.71 trillion at the end of 2024. The increase was led by a $204.7 billion increase in the position from Europe, which reflected a $52.9 billion increase from the United Kingdom and a $39.7 billion increase from Germany. By industry, affiliates in manufacturing increased the most.
Principal Federal Economic Indicators
Noteworthy
- 2025 News Release Schedule
- Innovation at BEA
- 2025 Annual Updates
- New! Services Trade Data for More Countries
- Data Tool: Trade in Value Added
- Distribution of State Personal Income
- Updated: RIMS II Regional Multipliers
- Arts and Culture
- Space Economy
- FDI Now in State BEARFACTS
- Quick Guide: Price Indexes
The Latest
Swim, Sail or Ski to bea.gov for an Outdoor Rec Preview
BEA’s first look at the outdoor recreation economy is coming Feb. 14, but you can get a sneak peek right now at what the statistics will cover.
We’ve posted the blank data tables on the Outdoor Recreation Satellite Account page of bea.gov. Glance over the tables to see how BEA will present its prototype statistics on activities like camping, hunting and boating, as well as related production by industries, such as retail trade,…
2017 Trade Gap is $566.0 Billion
The U.S. international trade deficit increased in 2017 according to the U.S. Bureau of Economic Analysis and the U.S. Census Bureau. The deficit increased from $504.8 billion in 2016 to $566.0 billion in 2017, as imports increased more than exports. As a percentage of U.S. gross domestic product, the goods and services deficit was 2.9 percent in 2017, up from 2.7 percent in 2016. The goods deficit increased from $752.5 billion in 2016 to $810…
U.S. International Trade in Goods and Services, December 2017
The U.S. monthly international trade deficit increased in December 2017 according to the U.S. Bureau of Economic Analysis and the U.S. Census Bureau. The deficit increased from $50.4 billion in November (revised) to $53.1 billion in December, as imports increased more than exports.
Coming Soon: BEA to Release Prototype Statistics on the Economic Impact of Outdoor Recreation
The U.S. Bureau of Economic Analysis on Feb. 14 will release for the first time prototype statistics measuring the economic effects of outdoor recreation – pursuits like boating, RVing and snowboarding.
These prototype statistics covering 2012-2016 will be available in a news release and data tables posted on BEA’s website at 8:30 a.m. Eastern time.
Real Consumer Spending Rises in December
Personal income increased 0.4 percent in December after increasing 0.3 percent in November. Wages and salaries, the largest component of personal income, increased 0.5 percent in December after increasing 0.4 percent in November.
Personal Income and Outlays, December 2017
Personal income increased 0.4 percent in December after increasing 0.3 percent in November. Wages and salaries, the largest component of personal income, increased 0.5 percent in December after increasing 0.4 percent in November.
GDP Increases in Fourth Quarter
Real gross domestic product (GDP) increased 2.6 percent in the fourth quarter of 2017, according to the “advance” estimate released by the Bureau of Economic Analysis. In the third quarter, real GDP increased 3.2 percent.
Gross Domestic Product, 4th quarter and annual 2017 (advance estimate)
Real gross domestic product (GDP) increased 2.6 percent in the fourth quarter of 2017, according to the “advance” estimate released by the Bureau of Economic Analysis. In the third quarter, real GDP increased 3.2 percent.
Gross Domestic Product (GDP) by State: Third Quarter 2017
Real gross domestic product (GDP) increased in every state and the District of Columbia in the third quarter of 2017. Real GDP by state growth in the third quarter ranged from 5.7 percent in Delaware to 0.5 percent in South Dakota.
Gross Domestic Product by State, 3rd quarter 2017
Real gross domestic product (GDP) increased in every state and the District of Columbia in the third quarter of 2017, according to statistics on the geographic breakout of GDP released today by the U.S. Bureau of Economic Analysis. Real GDP by state growth in the third quarter ranged from 5.7 percent in Delaware to 0.5 percent in South Dakota (table 1).


