Bureau of Economic Analysis
Direct Investment by Country and Industry, 2024
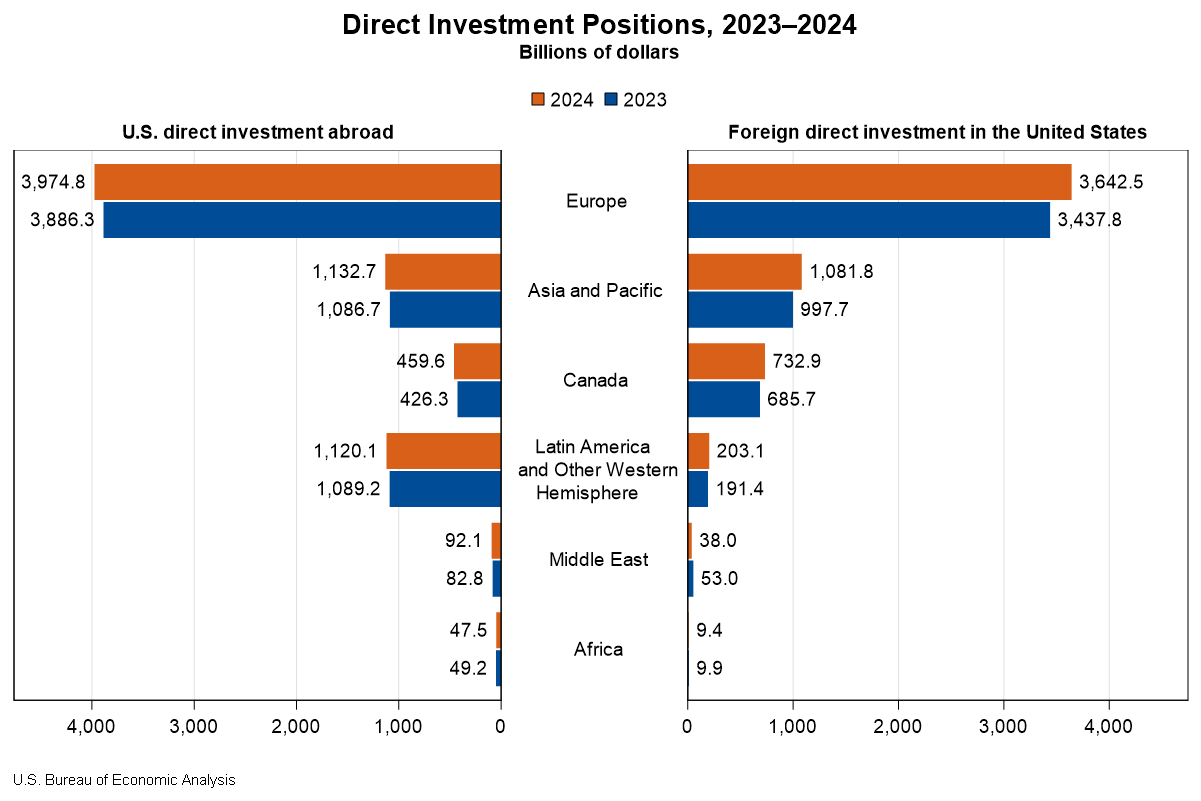
The U.S. direct investment abroad position, or cumulative level of investment, increased $206.3 billion to $6.83 trillion at the end of 2024, according to statistics released today by the U.S. Bureau of Economic Analysis. The increase was led by an $88.4 billion increase in the position in Europe, primarily in Luxembourg and Germany. By industry, manufacturing affiliates had the largest increase, led by manufacturing of computers and electronic products.
The foreign direct investment in the United States position increased $332.1 billion to $5.71 trillion at the end of 2024. The increase was led by a $204.7 billion increase in the position from Europe, which reflected a $52.9 billion increase from the United Kingdom and a $39.7 billion increase from Germany. By industry, affiliates in manufacturing increased the most.
Principal Federal Economic Indicators
Noteworthy
- 2025 News Release Schedule
- Innovation at BEA
- 2025 Annual Updates
- New! Services Trade Data for More Countries
- Data Tool: Trade in Value Added
- Distribution of State Personal Income
- Updated: RIMS II Regional Multipliers
- Arts and Culture
- Space Economy
- FDI Now in State BEARFACTS
- Quick Guide: Price Indexes
The Latest
State Personal Income: Second Quarter 2013
State personal incomes grew 1.0 percent on average in the second quarter of 2013 after falling 1.3 percent in the first quarter. Personal income growth ranged from 1.5 percent in Florida and Arizona to –0.7 percent in Nebraska. The national price index for personal consumption expenditures was unchanged in the second quarter after rising 0.3 percent in the first quarter.
For more information on state personal income, see the…
State Quarterly Personal Income, 1st quarter 2001-2nd quarter 2013; State Annual Personal Income, 2001-2012 (benchmark estimate)
State personal incomes grew 1.0 percent on average in the second quarter of 2013 after falling 1.3 percent in the first quarter, according to estimates released today by the U.S. Bureau of Economic Analysis. Personal income growth ranged from 1.5 percent in Florida and Arizona to -0.7 percent in Nebraska. The national price index for personal consumption expenditures was unchanged in the second quarter after rising 0.3 percent in the first…
Personal Income Increases in August
Personal income increased 0.4 percent in August after increasing 0.2 percent in July. Wages and salaries, the largest component of personal income, increased 0.4 percent in August after decreasing 0.3 percent in July. Government wages were reduced in August and in July due to furloughs.
Current-dollar disposable personal income (DPI), after-tax income, increased 0.5 percent in August after increasing 0.3 percent in July…
Personal Income and Outlays, August 2013
Personal income increased $57.2 billion, or 0.4 percent, and disposable personal income (DPI) increased $56.2 billion, or 0.5 percent, in August, according to the Bureau of Economic Analysis. Personal consumption expenditures (PCE) increased $34.5 billion, or 0.3 percent. In July, personal income increased $21.2 billion, or 0.2 percent, DPI increased $32.7 billion, or 0.3 percent, and PCE increased $18.3 billion, or 0.2 percent, based on…
GDP Growth Accelerates in Second Quarter
Real gross domestic product (GDP) increased 2.5 percent in the second quarter of 2013 after increasing 1.1 percent in the first quarter, according to the “third” estimate released by the Bureau of Economic Analysis (BEA). The second-quarter growth rate was the same as the “second” estimate released in August.
GDP growth highlights The second-quarter acceleration reflected upturns in business investment, mainly in power and…
Gross Domestic Product, 2nd quarter 2013 (third estimate); Corporate Profits, 2nd quarter 2013 (revised estimate)
Real gross domestic product -- the output of goods and services produced by labor and property located in the United States -- increased at an annual rate of 2.5 percent in the second quarter of 2013 (that is, from the first quarter to the second quarter), according to the "third" estimate released by the Bureau of Economic Analysis. In the first quarter, real GDP increased 1.1 percent. The GDP estimate released today is based on…
Value of Foreign Investments in the United States and U.S. Investments Abroad Decreased in Second Quarter 2013
The U.S. net international investment position was –$4,504.1 billion (preliminary) at the end of the second quarter of 2013 compared with –$4,236.6 billion (revised) at the end of the first quarter, as the value of foreign investments in the United States exceeded the value of U.S. investments abroad.
U.S. International Investment Position, 2nd quarter 2013
The U.S. net international investment position at the end of the second quarter of 2013 was -$4,504.1 billion (preliminary) as the value of foreign investments in the United States exceeded the value of U.S. investments abroad (table 1). At the end of the first quarter, the U.S. net international investment position was -$4,236.6 billion (revised).
Travel and Tourism Spending Decelerated in the Second Quarter of 2013
Real spending on travel and tourism decelerated in the second quarter of 2013, increasing at an annual rate of 2.5 percent after increasing 7.3 percent revised) in the first quarter of 2013.
A New Look at State-Level R&D by Multinational Companies
The amount of research and development (R&D) generated by multinational companies varies widely across U.S. states.
A new examination of data shows that the R&D performed by foreign-owned U.S. affiliates in 2007 ranged from $1 million in South Dakota to $5.3 billion in California. In addition to California, the R&D of U.S. affiliates was higher than $2.5 billion in three other states: New Jersey, Pennsylvania, and…


