Bureau of Economic Analysis
Direct Investment by Country and Industry, 2024
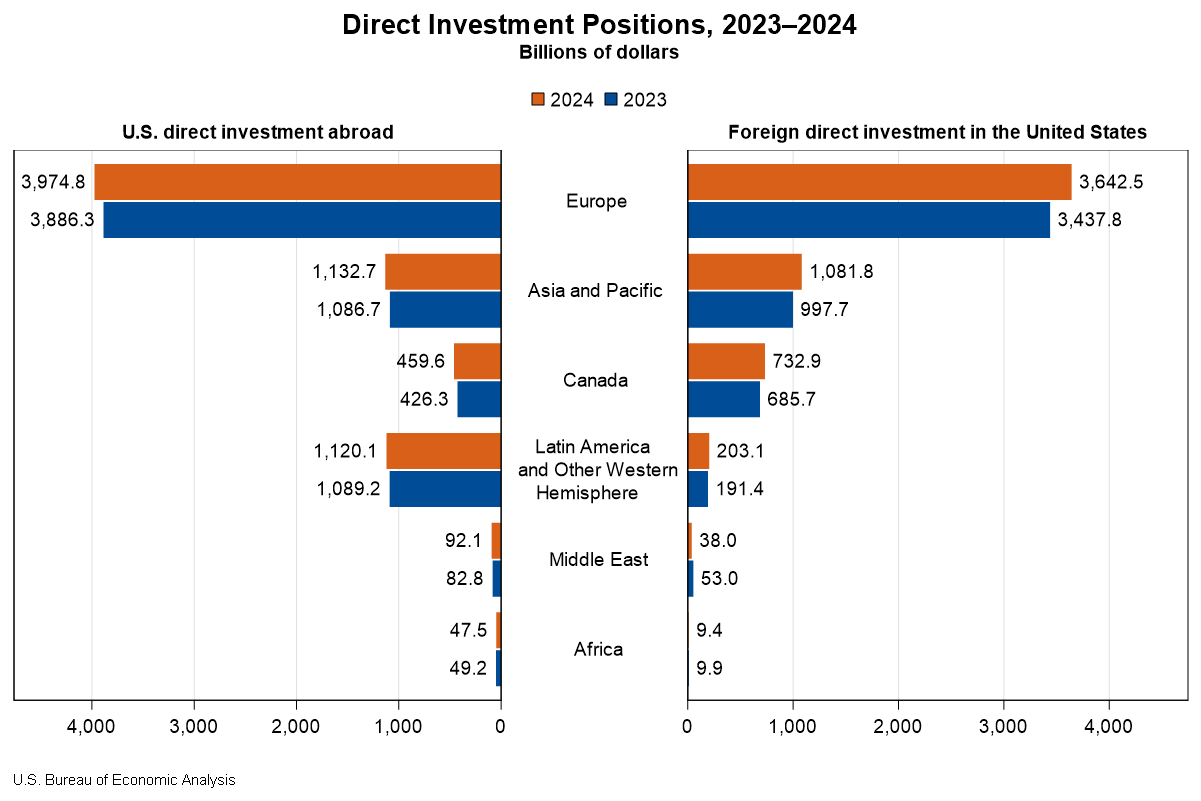
The U.S. direct investment abroad position, or cumulative level of investment, increased $206.3 billion to $6.83 trillion at the end of 2024, according to statistics released today by the U.S. Bureau of Economic Analysis. The increase was led by an $88.4 billion increase in the position in Europe, primarily in Luxembourg and Germany. By industry, manufacturing affiliates had the largest increase, led by manufacturing of computers and electronic products.
The foreign direct investment in the United States position increased $332.1 billion to $5.71 trillion at the end of 2024. The increase was led by a $204.7 billion increase in the position from Europe, which reflected a $52.9 billion increase from the United Kingdom and a $39.7 billion increase from Germany. By industry, affiliates in manufacturing increased the most.
Principal Federal Economic Indicators
Noteworthy
- 2025 News Release Schedule
- Innovation at BEA
- 2025 Annual Updates
- New! Services Trade Data for More Countries
- Data Tool: Trade in Value Added
- Distribution of State Personal Income
- Updated: RIMS II Regional Multipliers
- Arts and Culture
- Space Economy
- FDI Now in State BEARFACTS
- Quick Guide: Price Indexes
The Latest
Travel and Tourism Satellite Accounts, 2nd quarter 2013
Real spending on travel and tourism decelerated in the second quarter of 2013, increasing at an annual rate of 2.5 percent after increasing 7.3 percent (revised) in the first quarter of 2013. By comparison, growth in real gross domestic product (GDP) accelerated, increasing 2.5 percent (second estimate) in the second quarter after increasing 1.1 percent in the first quarter.
U.S. Current-Account Deficit Decreases in Second Quarter 2013
The U.S. current-account deficit—the combined balances on trade in goods and services, income, and net unilateral current transfers—decreased to $98.9 billion (preliminary) in the second quarter of 2013 from $104.9 billion (revised) in the first quarter of 2013.
U.S. International Transactions, 2nd quarter 2013
NOTE: See the navigation bar at the right side of the news release text for links to data tables, contact personnel and their telephone numbers, and supplementary materials. -->
Sarah P. Scott: (202) 606-9286 (Data) Paul W. Farello: (202) 606-9561 (Revisions)
Economic Growth Widespread Across Metropolitan Areas in 2012
Metropolitan areas accounted for nearly 91 percent of national current-dollar gross domestic product (GDP). The ten largest metropolitan areas accounted for 34 percent of national GDP in 2012, while the smallest 79 metropolitan areas accounted for less than 2 percent of national GDP. Real GDP grew in 305 metropolitan areas. Durable-goods manufacturing, trade, and financial activities led growth in 2012.
Gross Domestic Product by Metropolitan Area, 2012 and Revised 2001-2011
ECONOMIC GROWTH WIDESPREAD ACROSS METROPOLITAN AREAS IN 2012 Advance 2012, and Revised 20012011 GDP-by-Metropolitan-Area Statistics
Improving the Economic Measurement Toolkit: Partnerships Between Businesses and Federal Statistical Agencies
Businesses and federal statistical agencies have a long history of working together to produce something that is vitally important to both groups: the nation’s economic measurement toolkit.
Steve Landefeld, director of the Commerce Department’s Bureau of Economic Analysis, charted the history of this collaboration and underscored the importance of continuing that partnership during a panel session Tuesday at the National Association…
American Samoa Gross Domestic Product, 2011-2012
This release is available as a PDF download.
American Samoa's Economy Grows in 2011, Shrinks in 2012
The estimates of gross domestic product (GDP) for American Samoa show that real GDP, adjusted to remove price changes, increased 0.5 percent in 2011 and decreased 2.4 percent in 2012.
For comparison, real GDP for the United States (excluding the territories) increased 1.8 percent in 2011 and 2.8 percent in 2012.
July 2013 Trade Gap is $39.1 Billion
The U.S. monthly international trade deficit increased in July 2013 according to the U.S. Bureau of Economic Analysis and the U.S. Census Bureau. The deficit increased from $34.5 billion in June (revised) to $39.1 billion in July as exports decreased and imports increased. The previously published June deficit was $34.2 billion. The goods deficit increased $4.5 billion from June to $58.6 billion in July; the services surplus decreased $0.1…


