Bureau of Economic Analysis
U.S. International Investment Position, 2nd Quarter 2025
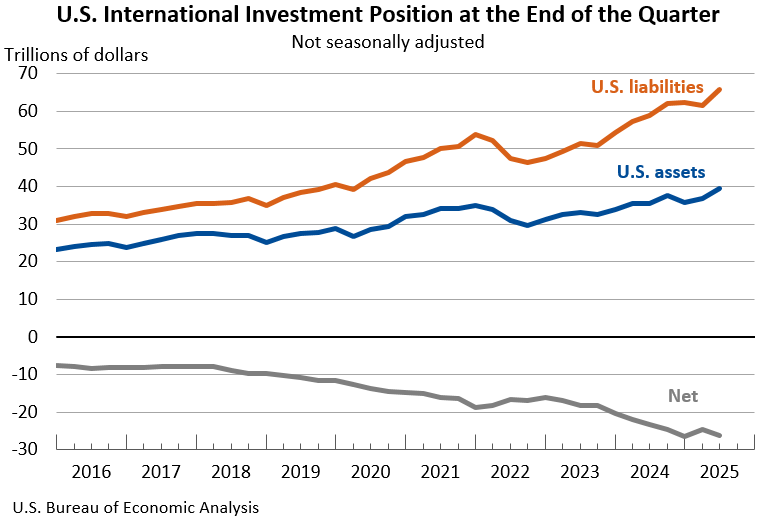
The U.S. net international investment position, the difference between U.S. residents’ foreign financial assets and liabilities, was -$26.14 trillion at the end of the second quarter of 2025, according to statistics released today by the U.S. Bureau of Economic Analysis. Assets totaled $39.56 trillion, and liabilities were $65.71 trillion. At the end of the first quarter, the net investment position was -$24.65 trillion (revised).
Principal Federal Economic Indicators
Noteworthy
The Latest
BEA Constantly Innovates to Produce New Statistics Measuring the U.S. Economy
The Bureau of Economic Analysis is producing new economic statistics over the course of this year that offer businesses and households additional tools to make informed decisions and illustrate BEA’s innovative approach to better measure the dynamic U.S. economy.
December 2014 Trade Gap is $46.6 Billion
The U.S. monthly international trade deficit increased in December 2014 according to the U.S. Bureau of Economic Analysis and the U.S. Census Bureau. The deficit increased from $39.8 billion in November (revised) to $46.6 billion in December, as exports decreased and imports increased. The previously published November deficit was $39.0 billion. The goods deficit increased $6.9 billion from November to $66.0 billion in December. The…
2014 Trade Gap is $505.0 Billion
The U.S. international trade deficit increased in 2014, according to the U.S. Bureau of Economic Analysis and the U.S. Census Bureau. The deficit increased from $476.4 billion in 2013 to $505.0 billion in 2014, as imports increased more than exports. As a percentage of U.S. gross domestic product, the goods and services deficit was 2.9 percent in 2014, up from 2.8 percent in 2013. The goods deficit increased from $701.7 billion in 2013 to $…
U.S. International Trade in Goods and Services, December 2014
U.S. Census Bureau U.S. Bureau of Economic Analysis NEWS U.S. Department of Commerce * Washington, DC 20230 U.S. INTERNATIONAL TRADE IN GOODS AND SERVICES December 2014 The U.S. Census Bureau and the U.S.
Consumer Spending Falls In December
Personal income rose 0.3 percent in December, the same increase as in November. Wages and salaries, the largest component of personal income, rose 0.1 percent in December after rising 0.6 percent in November.
Personal Income and Outlays, December 2014
Personal income increased $41.3 billion, or 0.3 percent, and disposable personal income (DPI) increased $35.8 billion, or 0.3 percent, in December, according to the Bureau of Economic Analysis. Personal consumption expenditures (PCE) decreased $40.0 billion, or 0.3 percent. In November, personal income increased $47.2 billion, or 0.3 percent, DPI increased $34.2 billion, or 0.3 percent, and PCE increased $58.8 billion, or 0.5 percent, based…
GDP increases in Fourth Quarter
Real gross domestic product (GDP) increased 2.6 percent in the fourth quarter of 2014, according to the “advance” estimate released by the Bureau of Economic Analysis. In the third quarter, real GDP increased 5.0 percent. For the full year 2014, real GDP rose 2.4 percent after rising 2.2 percent in 2013.
Fourth-quarter GDP highlights The increase in GDP in the fourth quarter reflected the following:
Gross Domestic Product, 4th quarter and annual 2014 (advance estimate)
Real gross domestic product -- the value of the production of goods and services in the United States, adjusted for price changes -- increased at an annual rate of 2.6 percent in the fourth quarter of 2014, according to the "advance" estimate released by the Bureau of Economic Analysis.
Widespread Growth Across Industries Continues in Third Quarter 2014
Real gross domestic product (GDP) increased at an annual rate of 5.0 percent in the third quarter of 2014, reflecting positive contributions from 20 of 22 industry groups. The private goods- and services-producing industries, as well as the government sector, contributed to the increase.
Introducing the New BEA Health Care Satellite Account
Total health care spending reached 17.4 percent of gross domestic product (GDP) in 2013, and that share is expected to continue to grow significantly, according to the Centers for Medicare and Medicaid Services. Given this trend, it is critical to develop an understanding of what those increased expenditures represent. Are the increases attributable to rising costs of treatment or more individuals receiving medical care? What medical…


