Bureau of Economic Analysis
U.S. International Investment Position, 2nd Quarter 2025
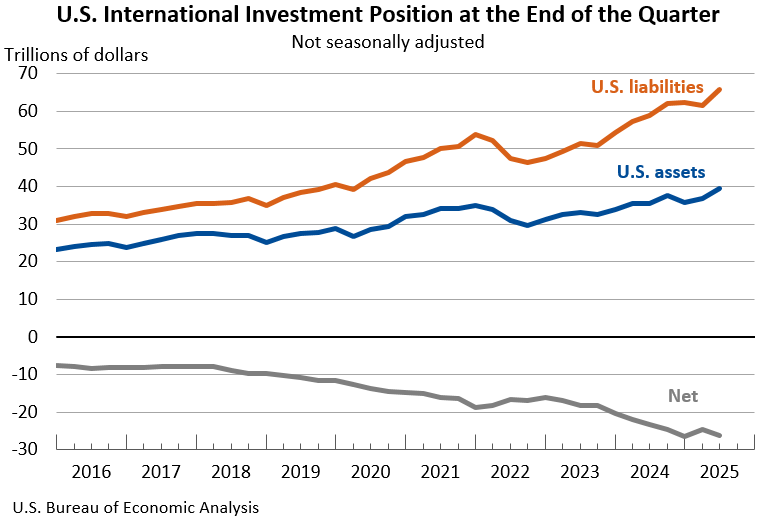
The U.S. net international investment position, the difference between U.S. residents’ foreign financial assets and liabilities, was -$26.14 trillion at the end of the second quarter of 2025, according to statistics released today by the U.S. Bureau of Economic Analysis. Assets totaled $39.56 trillion, and liabilities were $65.71 trillion. At the end of the first quarter, the net investment position was -$24.65 trillion (revised).
Principal Federal Economic Indicators
Noteworthy
The Latest
Gross Domestic Product for Guam, 2011-2012
This release is available as a PDF download.
October 2013 Trade Gap is $40.6 Billion
The U.S. monthly international trade deficit decreased in October 2013 according to the U.S. Bureau of Economic Analysis and the U.S. Census Bureau. The deficit decreased from $43.0 billion in September (revised) to $40.6 billion in October as exports increased more than imports. The previously published September deficit was $41.8 billion. The goods deficit decreased $2.2 billion from September to $60.2 billion in October; the services…
Guam's Economy Grows 0.5 Percent in 2012
Newly published estimates for Guam show that real gross domestic product (GDP)—GDP adjusted to remove price changes—increased 0.5 percent in 2012, after decreasing 0.6 percent in 2011.
For comparison, real GDP for the United States (excluding the territories) increased 2.8 percent in 2012 and 1.8 percent in 2011.
In 2012, the increase in real GDP reflected an improvement in the trade balance. Exports of services—primarily…
Northern Mariana Islands' Economy Grows in 2012, Shrinks in 2011
Newly published estimates for the Commonwealth of the Northern Mariana Islands show that real Gross Domestic Product, GDP adjusted to remove price changes, increased 5.2 percent in 2012 after decreasing 6.8 percent in 2011.
For comparison, real GDP for the United States (excluding the territories) increased 2.8 percent in 2012 and 1.8 percent in 2011.
Gross Domestic Product for the Commonwealth of the Northern Mariana Islands (CNMI), 2011-2012
This release is available as a PDF download.
Some Local Economic Statistics Eliminated Due to 2013 Budget Sequester
You probably noticed that today’s release of the Bureau of Economic Analysis’ (BEA) local area personal income statistics is missing some detail that’s normally included. Why?
Local Area Personal Income: Metropolitan Areas, 2001–2012
Personal income growth slowed in 2012 in most of the nation’s 381 metropolitan statistical areas (MSAs). Personal income growth slowed in 311 MSAs, accelerated in 65 MSAs, and remained unchanged in 5 MSAs. On average, MSA personal income rose 4.2 percent in 2012, after growing 6.0 percent in 2011. Personal income growth ranged from 12.1 percent in Midland, TX, to –1.6 percent in Yuma, AZ, one of only five MSAs where personal income declined…
Local Area Personal Income, 2001-2012 (benchmark estimate)
Personal income growth slowed in 2012 in most of the nations 381 metropolitan statistical areas (MSAs), according to estimates released today by the U.S. Bureau of Economic Analysis. Personal income growth slowed in 311 MSAs, accelerated in 65 MSAs, and remained unchanged in 5 MSAs. On average, MSA personal income rose 4.2 percent in 2012, after growing 6.0 percent in 2011. Personal income growth ranged from 12.1 percent in Midland, Texas to…
September 2013 Trade Gap is $41.8 Billion
The U.S. monthly international trade deficit increased in September 2013 according to the U.S. Bureau of Economic Analysis and the U.S. Census Bureau. The deficit increased from $38.7 billion in August (revised) to $41.8 billion in September as exports decreased and imports increased. The previously published August deficit was $38.8 billion. The goods deficit increased $3.0 billion from August to $61.3 billion in September; the services…


