Bureau of Economic Analysis
U.S. International Investment Position, 2nd Quarter 2025
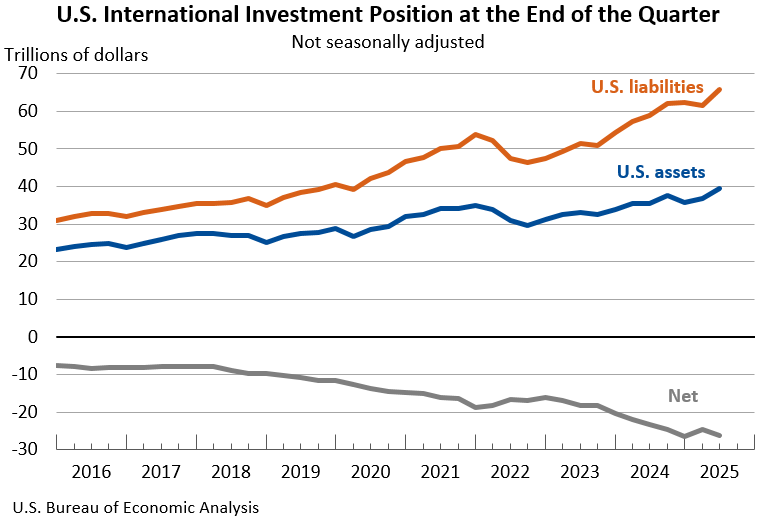
The U.S. net international investment position, the difference between U.S. residents’ foreign financial assets and liabilities, was -$26.14 trillion at the end of the second quarter of 2025, according to statistics released today by the U.S. Bureau of Economic Analysis. Assets totaled $39.56 trillion, and liabilities were $65.71 trillion. At the end of the first quarter, the net investment position was -$24.65 trillion (revised).
Principal Federal Economic Indicators
Noteworthy
The Latest
Personal Income Increases in September
Personal income rose 0.5 percent in September, the same as in August. Wages and salaries, the largest component of personal income, rose 0.4 percent after rising 0.5 percent. Farm proprietors’ income was boosted in September, reflecting the settlement of a class-action discrimination lawsuit against the U. S. Department of Agriculture.
Current-dollar disposable personal income (DPI), after-tax income, rose 0.5…
Personal Income and Outlays, September 2013
Personal income increased $67.4 billion, or 0.5 percent, and disposable personal income (DPI) increased $64.8 billion, or 0.5 percent, in September, according to the Bureau of Economic Analysis. Personal consumption expenditures (PCE) increased $24.7 billion, or 0.2 percent.
GDP Growth Picks Up in Third Quarter
Real gross domestic product (GDP) increased 2.8 percent in the third quarter of 2013, according to the “advance” estimate released by the Bureau of Economic Analysis. In the second quarter, the growth rate was 2.5 percent.
GDP growth The third-quarter growth reflected the following:
Gross Domestic Product, 3rd quarter 2013 (advance estimate)
Real gross domestic product -- the output of goods and services produced by labor and property located in the United States -- increased at an annual rate of 2.8 percent in the third quarter of 2013 (that is, from the second quarter to the third quarter), according to the "advance" estimate released by the Bureau of Economic Analysis.
State Personal Income: Second Quarter 2013
State personal incomes grew 1.0 percent on average in the second quarter of 2013 after falling 1.3 percent in the first quarter. Personal income growth ranged from 1.5 percent in Florida and Arizona to –0.7 percent in Nebraska. The national price index for personal consumption expenditures was unchanged in the second quarter after rising 0.3 percent in the first quarter.
For more information on state personal income, see the…
State Quarterly Personal Income, 1st quarter 2001-2nd quarter 2013; State Annual Personal Income, 2001-2012 (benchmark estimate)
State personal incomes grew 1.0 percent on average in the second quarter of 2013 after falling 1.3 percent in the first quarter, according to estimates released today by the U.S. Bureau of Economic Analysis. Personal income growth ranged from 1.5 percent in Florida and Arizona to -0.7 percent in Nebraska. The national price index for personal consumption expenditures was unchanged in the second quarter after rising 0.3 percent in the first…
Personal Income Increases in August
Personal income increased 0.4 percent in August after increasing 0.2 percent in July. Wages and salaries, the largest component of personal income, increased 0.4 percent in August after decreasing 0.3 percent in July. Government wages were reduced in August and in July due to furloughs.
Current-dollar disposable personal income (DPI), after-tax income, increased 0.5 percent in August after increasing 0.3 percent in July…
Personal Income and Outlays, August 2013
Personal income increased $57.2 billion, or 0.4 percent, and disposable personal income (DPI) increased $56.2 billion, or 0.5 percent, in August, according to the Bureau of Economic Analysis. Personal consumption expenditures (PCE) increased $34.5 billion, or 0.3 percent. In July, personal income increased $21.2 billion, or 0.2 percent, DPI increased $32.7 billion, or 0.3 percent, and PCE increased $18.3 billion, or 0.2 percent, based on…


