Bureau of Economic Analysis
U.S. International Investment Position, 2nd Quarter 2025
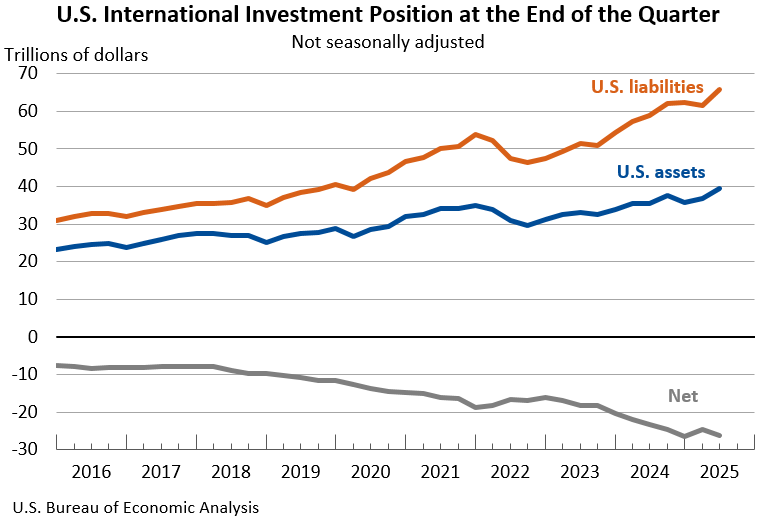
The U.S. net international investment position, the difference between U.S. residents’ foreign financial assets and liabilities, was -$26.14 trillion at the end of the second quarter of 2025, according to statistics released today by the U.S. Bureau of Economic Analysis. Assets totaled $39.56 trillion, and liabilities were $65.71 trillion. At the end of the first quarter, the net investment position was -$24.65 trillion (revised).
Principal Federal Economic Indicators
Noteworthy
The Latest
U.S. Virgin Islands (USVI) Gross Domestic Product, 2011-2012
This release is available as a PDF download.
Economic Activity in Virgin Islands Decreases in 2012 and 2011
The estimates of gross domestic product (GDP) for the U.S. Virgin Islands show that real GDP—adjusted to remove price changes—decreased 13.2 percent in 2012 after decreasing 6.6 percent in 2011.
In contrast, real GDP for the United States (excluding the territories) increased 2.8 percent in 2012 after increasing 1.8 percent in 2011.
The decline in the Virgin Islands economy reflected decreases in exports of goods and…
June 2013 Trade Gap is $34.2 Billion
The U.S. monthly international trade deficit decreased in June 2013, according to the U.S. Bureau of Economic Analysis and the U.S. Census Bureau. The deficit decreased from $44.1 billion in May (revised) to $34.2 billion in June as exports increased and imports decreased. The previously published May deficit was $45.0 billion. The goods deficit decreased $9.7 billion from May to $53.2 billion in June; the services surplus increased $0.2…
Personal Income and Outlays, June 2013
Personal income increased $45.4 billion, or 0.3 percent, and disposable personal income (DPI) increased $33.6 billion, or 0.3 percent, in June, according to the Bureau of Economic Analysis. Personal consumption expenditures (PCE) increased $59.4 billion, or 0.5 percent. In May, personal income increased $49.5 billion, or 0.4 percent, DPI increased $38.2 billion, or 0.3 percent, and PCE increased $19.3 billion, or 0.2 percent, based on…
Personal Income Increases in June
Personal income increased 0.3 percent in June after increasing 0.4 percent in May. Wages and salaries, the largest component of personal income, increased 0.5 percent in June after increasing 0.3 percent in May.
Current-dollar disposable personal income (DPI), after-tax income, increased 0.3 percent in June, the same increase as in May.
Real DPI, income adjusted for taxes and inflation, fell 0.1 percent in June after…
New Detail Available on Direct Investment for 2009–2012
Interested in learning about foreign direct investment in the U.S. advertising industry? Or in U.S. direct investment in Vietnam? The U.S. Bureau of Economic Analysis (BEA) released its most detailed statistics on U.S.
Gross Domestic Product, 2nd quarter 2013 (advance estimate); Comprehensive Revision: 1929 through 1st quarter 2013
Real gross domestic product -- the output of goods and services produced by labor and property located in the United States -- increased at an annual rate of 1.7 percent in the second quarter of 2013 (that is, from the first quarter to the second quarter), according to the "advance" estimate released by the Bureau of Economic Analysis.
GDP Growth Accelerates in Second Quarter
Real gross domestic product (GDP) increased 1.7 percent in the second quarter of 2013 after increasing 1.1 percent in the first quarter, according to the “advance” estimate released today by the Bureau of Economic Analysis (BEA).
GDP highlights The second-quarter acceleration in GDP reflected the following:
Changes to How the U.S. Economy is Measured Roll Out July 31
A pharmaceutical company develops a new cancer drug. A Hollywood studio creates a box-office blockbuster. A song writer records a new hit. On July 31, BEA will begin including the amount of money businesses invest in the production of such intellectual property as part of gross domestic product (GDP).
Why?


