June 30, 2025

U.S. International Investment Position, 1st Quarter 2025 and Annual Update

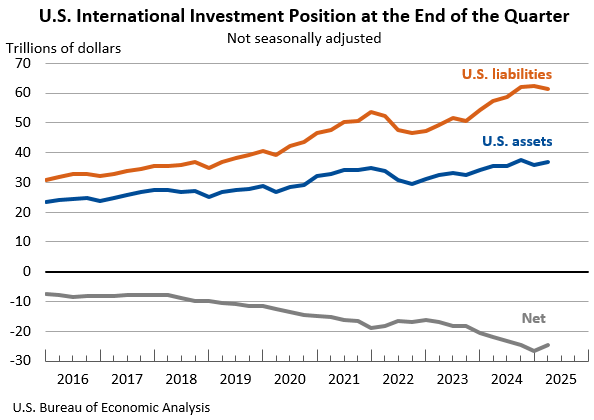
The U.S. net international investment position, the difference between U.S. residents’ foreign financial assets and liabilities, was -$24.61 trillion at the end of the first quarter of 2025, according to statistics released today by the U.S. Bureau of Economic Analysis. Assets totaled $36.85 trillion, and liabilities were $61.47 trillion. At the end of the fourth quarter of 2024, the net investment position was -$26.54 trillion (revised).
Principal Federal Economic Indicators

Gross Domestic Product
Q1 2025 (3rd)
-0.5%
Personal Income
May 2025
-0.4%
International Trade in Goods and Services
April 2025
-$61.6 B
International Transactions
Q1 2025
-$450.2 B

Noteworthy

The Latest

Personal Income and Outlays, May 2013

June 27, 2013 | News Release

Personal income increased $69.4 billion, or 0.5 percent, and disposable personal income (DPI) increased $57.0 billion, or 0.5 percent, in May, according to the Bureau of Economic Analysis. Personal consumption expenditures (PCE) increased $29.0 billion, or 0.3 percent. In April, personal income increased $18.3 billion, or 0.1 percent, DPI increased $6.5 billion, or 0.1 percent, and PCE decreased $39.6 billion, or 0.3 percent, based on revised…

GDP Growth Picks Up in First Quarter

June 26, 2013 | The BEA Wire

Real gross domestic product (GDP) increased 1.8 percent in the first quarter of 2013 after increasing 0.4 percent in the fourth quarter of 2012, according to the third estimate released by the Bureau of Economic Analysis. The first quarter growth rate was revised down 0.6 percentage point from the second estimate released in May.

GDP highlights

Inventory investment turned up notably, more than accounting for the acceleration in…

Gross Domestic Product, 1st quarter 2013 (third estimate); Corporate Profits, 1st quarter 2013 (revised estimate)

June 26, 2013 | News Release

Real gross domestic product -- the output of goods and services produced by labor and property located in the United States -- increased at an annual rate of 1.8 percent in the first quarter of 2013 (that is, from the fourth quarter to the first quarter), according to the "third" estimate released by the Bureau of Economic Analysis. In the fourth quarter, real GDP increased 0.4 percent. The GDP estimate released today is based on…

Value of Foreign Investments in the United States Increased and Value of U.S. Investments Abroad Decreased in First Quarter 2013

June 25, 2013 | The BEA Wire

The U.S. net international investment position was -$4,277.1 billion (preliminary) at the end of the first quarter of 2013 compared with -$3,863.9 billion (revised) at the end of the fourth quarter of 2012, as the value of foreign investments in the United States exceeded the value of U.S. investments abroad.

Value of Foreign Investments in the United States Increased More Than Value of U.S. Investments Abroad in 2012

June 25, 2013 | The BEA Wire

The U.S. net international investment position was -$3,863.9 billion (revised) at the end of 2012 compared with -$3,730.6 billion (revised) at the end of 2011, as the value of foreign investments in the United States exceeded the value of U.S. investments abroad.

Improved Source Data Leads to Upward Revisions to the U.S. International Investment Position

June 25, 2013 | The BEA Wire

Better data generated by a new government survey drove the large upward revisions in U.S. international investment position statistics released today that trimmed the United States’ investment deficit with the rest of the world between 2010 and 2012.

The Treasury Department and the Federal Reserve Board conducted the new survey called Aggregate Holdings of Long-Term Securities by U.S. and Foreign Residents (SLT), which includes…

U.S. International Investment Position, 1st Quarter 2013, Year 2012, and Annual Revisions

June 25, 2013 | News Release

Quarterly and Annual Statistics

In this release, BEA presents the U.S. international investment position statistics for the first quarter of 2013 along with historical revisions and detailed annual statistics for 2012, including changes in positions resulting from annual financial flows and valuation changes such as price, exchange-rate, and other changes. Quarterly positions are revised for the first quarter of 2009 to the fourth…

Travel and Tourism Spending Outpaced Growth in the Overall Economy in the First Quarter of 2013

June 24, 2013 | The BEA Wire

Real spending on travel and tourism accelerated in the first quarter of 2013, increasing at an annual rate of 6.8 percent after increasing 2.1 percent (revised) in the fourth quarter of 2012. By comparison, growth in real gross domestic product (GDP) increased 2.4 percent (second estimate) in the first quarter after increasing 0.4 percent in the fourth quarter.

Travel and Tourism Satellite Accounts, 1st quarter 2013

June 24, 2013 | News Release

Real spending on travel and tourism accelerated in the first quarter of 2013, increasing at an annual rate of 6.8 percent after increasing 2.1 percent (revised) in the fourth quarter of 2012. By comparison, growth in real gross domestic product (GDP) increased 2.4 percent (second estimate) in the first quarter after increasing 0.4 percent in the fourth quarter.

BEA's Industry Economic Accounts to Hit Major Milestone

June 20, 2013 | The BEA Wire

Roughly every 5 years, the Bureau of Economic Analysis (BEA) releases comprehensive revisions of its major economic accounts. These revisions are generally more detailed than annual revisions, implementing changes in methods, statistics and definitions to better reflect an ever-evolving economy. In December, BEA will release the 2013 comprehensive revision of the Industry Economic Accounts (IEAs), which includes two main sets of statistics,…