Bureau of Economic Analysis
Activities of U.S. Multinational Enterprises, 2023
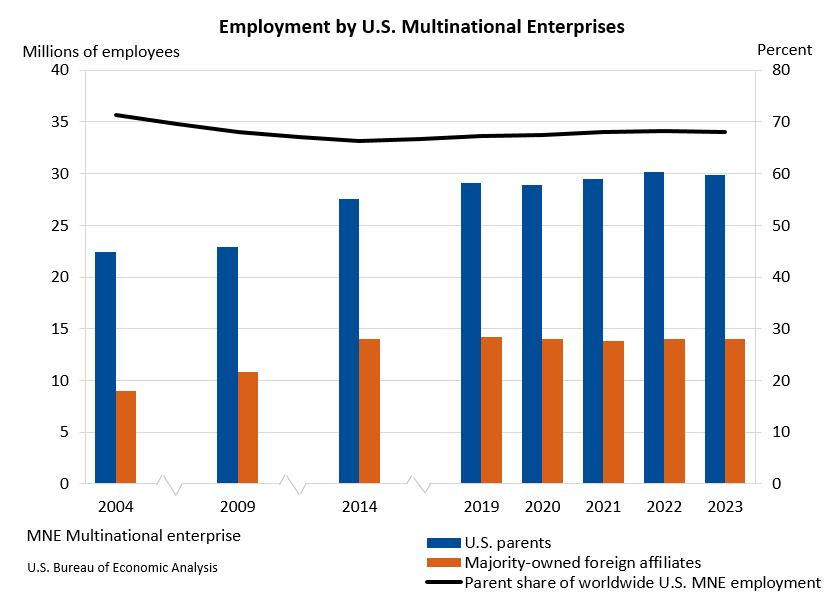
Worldwide employment by U.S. multinational enterprises decreased 0.4 percent to 43.9 million workers in 2023 (preliminary) from 44.1 million workers in 2022 (revised), according to statistics released today by the U.S. Bureau of Economic Analysis on the operations and finances of U.S. parent companies and their foreign affiliates.
Principal Federal Economic Indicators
Noteworthy
- 2025 News Release Schedule
- Innovation at BEA
- 2025 Annual Updates
- Distribution of Personal Income Nowcast
- New! Services Trade Data for More Countries
- Data Tool: Trade in Value Added
- Updated: RIMS II Regional Multipliers
- Arts and Culture
- Space Economy
- FDI Now in State BEARFACTS
- Quick Guide: Price Indexes
The Latest
BEA Focuses on Data Users With Innovations in 2017, New Projects Ahead
As we charge into 2018, it’s a fitting time to remember innovations over the past year that advanced the Bureau of Economic Analysis’ quest to produce the most accurate, timely, and objective statistics that promote better understanding of the nation’s economy.
Real Consumer Spending Rises in November
Personal income increased 0.3 percent in November after increasing 0.4 percent in October. Wages and salaries, the largest component of personal income, increased 0.4 percent in November after increasing 0.2 percent in October.
Personal Income And Outlays, November 2017
Personal income increased $54.0 billion (0.3 percent) in November according to estimates released today by the Bureau of Economic Analysis. Disposable personal income (DPI) increased $50.9 billion (0.4 percent) and personal consumption expenditures (PCE) increased $87.1 billion (0.6 percent).
GDP Up in the Third Quarter
Real gross domestic product (GDP) increased 3.2 percent in the third quarter of 2017, according to the “third” estimate released by the Bureau of Economic Analysis. The growth rate was 0.1 percentage point less than the “second” estimate released in November. In the second quarter of 2017, real GDP increased 3.1 percent.
Gross Domestic Product, 3rd quarter 2017 (third estimate); Corporate Profits, 3rd quarter 2017 (revised estimate)
Real gross domestic product (GDP) increased at an annual rate of 3.2 percent in the third quarter of 2017 (table 1), according to the "third" estimate released by the Bureau of Economic Analysis. In the second quarter, real GDP increased 3.1 percent.
State Personal Income, Third Quarter 2017
State personal income increased 0.7 percent on average in the third quarter of 2017. In the second quarter, state personal income increased 0.6 percent. Increases in earnings and personal current transfer receipts were the leading contributors to the acceleration in personal income in the third quarter.
State Quarterly Personal Income, 3rd quarter 2017
State personal income increased 0.7 percent on average in the third quarter of 2017, according to estimates released today by the Bureau of Economic Analysis (table 1). In the second quarter, state personal income increased 0.6 percent. Increases in earnings and personal current transfer receipts were the leading contributors to the acceleration in personal income in the third quarter.
U.S. Current-Account Deficit Decreases in Third Quarter 2017
The U.S. current-account deficit decreased to $100.6 billion (preliminary) in the third quarter of 2017 from $124.4 billion (revised) in the second quarter of 2017. As a percentage of U.S. GDP, the deficit decreased to 2.1 percent from 2.6 percent. The previously published current-account deficit for the second quarter was $123.1 billion.
U.S. International Transactions, 3rd quarter 2017
The U.S. current-account deficit decreased to $100.6 billion (preliminary) in the third quarter of 2017 from $124.4 billion (revised) in the second quarter of 2017, according to statistics released by the Bureau of Economic Analysis (BEA). The deficit decreased to 2.1 percent of current- dollar gross domestic product (GDP) from 2.6 percent in the second quarter.
The New Way to Find Industry Data Fast
Interested in industries? Our newest data tool shows you BEA’s statistics about an industry, pulled together in one place.
Industry Facts starts with a printable one-page overview of your industry of choice. There’s also a data table with more statistics and a longer time span, plus options for digging deeper into the numbers.


