Notice
Due to a lapse in appropriations, this website is not being updated.
Bureau of Economic Analysis
U.S. International Investment Position, 2nd Quarter 2025
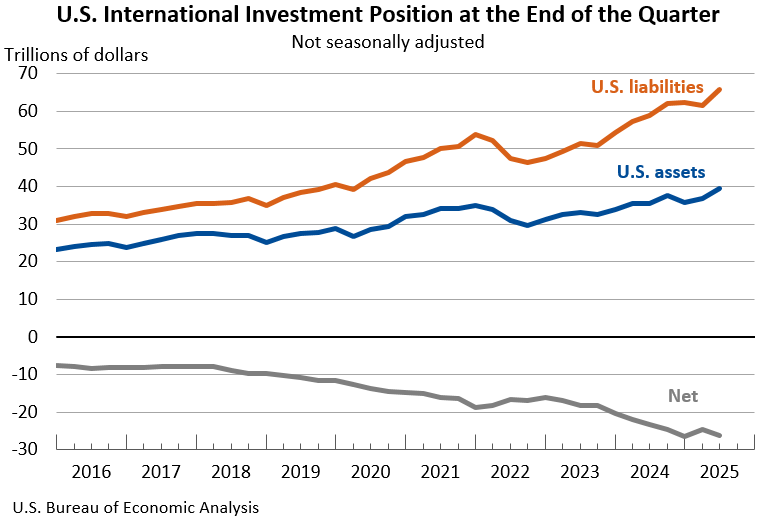
The U.S. net international investment position, the difference between U.S. residents’ foreign financial assets and liabilities, was -$26.14 trillion at the end of the second quarter of 2025, according to statistics released today by the U.S. Bureau of Economic Analysis. Assets totaled $39.56 trillion, and liabilities were $65.71 trillion. At the end of the first quarter, the net investment position was -$24.65 trillion (revised).
Principal Federal Economic Indicators
Noteworthy
The Latest
2015 Trade Gap is $531.5 Billion
The U.S. international trade deficit increased in 2015 according to the U.S. Bureau of Economic Analysis and the U.S. Census Bureau. The deficit increased from $508.3 billion in 2014 to $531.5 billion in 2015, as exports decreased more than imports. As a percentage of U.S. gross domestic product, the goods and services deficit was 3.0 percent in 2015, up from 2.9 percent in 2014. The goods deficit increased from $741.5 billion in 2014 to $758…
December 2015 Trade Gap is $43.4 Billion
The U.S. monthly international trade deficit increased in December 2015 according to the U.S. Bureau of Economic Analysis and the U.S. Census Bureau. The deficit increased from $42.2 billion in November (revised) to $43.4 billion in December, as exports decreased and imports increased. The previously published November deficit was $42.4 billion. The goods deficit increased $1.3 billion from November to $62.5 billion in December. The services…
U.S. International Trade in Goods and Services, December 2015
U.S. Census Bureau U.S. Bureau of Economic Analysis NEWS U.S. Department of Commerce * Washington, DC 20230 U.S. INTERNATIONAL TRADE IN GOODS AND SERVICES December 2015 The U.S. Census Bureau and the U.S.
Real Disposable Income Rises in December
Personal income increased 0.3 percent in December, the same increase as in November. Wages and salaries, the largest component of personal income, increased 0.2 percent in December after increasing 0.5 percent in November.
Personal Income and Outlays, December 2015
Personal income increased $42.5 billion, or 0.3 percent, and disposable personal income (DPI) increased $37.8 billion, or 0.3 percent, in December, according to the Bureau of Economic Analysis. Personal consumption expenditures (PCE) decreased $0.7 billion, or less than 0.1 percent.
GDP Increases in Fourth Quarter
Real gross domestic product (GDP) increased 0.7 percent in the fourth quarter of 2015, according to the “advance” estimate released by the Bureau of Economic Analysis. In the third quarter, real GDP increased 2.0 percent.
GDP highlights
Gross Domestic Product, 4th quarter and annual 2015 (advance estimate)
Real gross domestic product -- the value of the goods and services produced by the nation’s economy less the value of the goods and services used up in production, adjusted for price changes -- increased at an annual rate of 0.7 percent in the fourth quarter of 2015, according to the "advance" estimate released by the Bureau of Economic Analysis.
Industry in Focus: How Health Care and Social Assistance Fared in Third Quarter
Health care is an industry that many of us experience firsthand, whether receiving treatment for an illness or injury or simply getting an annual check-up. In the third quarter of 2015, health care and social assistance was the second-leading contributor to the 2 percent increase in the U.S. economy’s growth, providing 0.38 percentage point to real GDP.
Retail Trade Led Growth in the Third Quarter Gross Domestic Product by Industry
Retail trade; health care and social assistance; and agriculture, forestry, fishing, and hunting were the leading contributors to the increase in U.S. economic growth in the third quarter of 2015. Overall, 15 of 22 industry groups contributed to the 2.0 percent increase in real GDP in the third quarter.
Gross Domestic Product by Industry, 3rd quarter 2015
Retail trade; health care and social assistance; and agriculture, forestry, fishing, and hunting were the leading contributors to the increase in U.S. economic growth in the third quarter of 2015, according to statistics on the breakout of gross domestic product (GDP) by industry released today by the Bureau of Economic Analysis (BEA). Overall, 15 of 22 industry groups contributed to the 2.0 percent increase in real GDP in the third quarter…


