Notice
Due to a lapse in appropriations, this website is not being updated.
Bureau of Economic Analysis
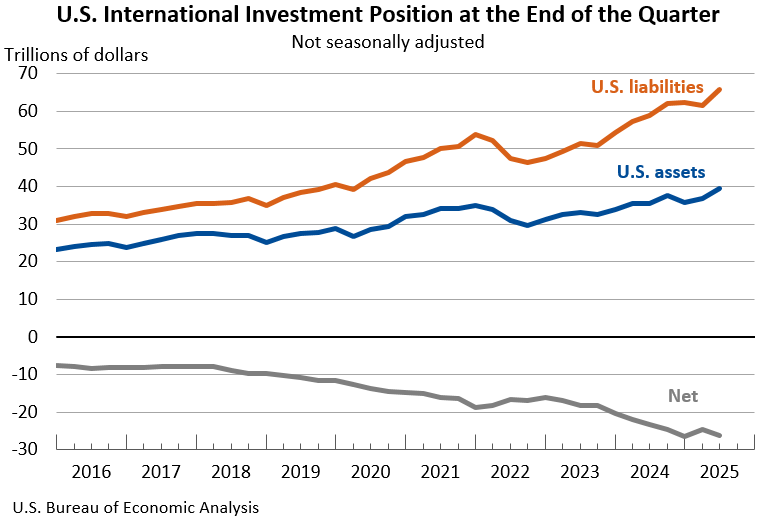
U.S. International Investment Position, 2nd Quarter 2025
The U.S. net international investment position, the difference between U.S. residents’ foreign financial assets and liabilities, was -$26.14 trillion at the end of the second quarter of 2025, according to statistics released today by the U.S. Bureau of Economic Analysis. Assets totaled $39.56 trillion, and liabilities were $65.71 trillion. At the end of the first quarter, the net investment position was -$24.65 trillion (revised).
Principal Federal Economic Indicators
Noteworthy
The Latest
Revised Statistics of Gross Domestic Product by Industry, 2004-2006
Revised Statistics of Gross Domestic Product by Industry, 2004-2006
Revised statistics on the industry distribution of real gross domestic product (GDP), released today by the U.S. Bureau of Economic Analysis, show that the private services-producing sector continued to lead overall GDP growth in 2006, increasing 4.2 percent, while growth in the private goods-producing sector slowed to 0.8 percent. Overall growth of the U.S. economy…
U.S. International Trade in Goods and Services: November 2007
U.S. Census Bureau U.S. Bureau of Economic Analysis NEWS U.S. Department of Commerce * Washington, DC 20230 U.S. INTERNATIONAL TRADE IN GOODS AND SERVICES November 2007 Goods and Services The U.S. Census Bureau and the U.S.
Personal Income and Outlays, November 2007
NOVEMBER 2007 Personal income increased $43.1 billion, or 0.4 percent, and disposable personal income (DPI) increased $32.9 billion, or 0.3 percent, in November, according to the Bureau of Economic Analysis. Personal consumption expenditures (PCE) increased $110.6 billion, or 1.1 percent.
County Estimates of Compensation by Industry, 2004-2006
WASHINGTON DC, DECEMBER 20, 2007 – Today, the Bureau of Economic Analysis (BEA) released county estimates of compensation by industry for 2004–2006. The estimates for 2004–2005 have been revised to incorporate newly available source data; the estimates for 2006 are released for the first time.
Gross Domestic Product and Corporate Profits: Third Quarter 2007 "final" estimates
Real gross domestic product -- the output of goods and services produced by labor and property located in the United States -- increased at an annual rate of 4.9 percent in the third quarter of 2007, according to final estimates released by the Bureau of Economic Analysis. In the second quarter, real GDP increased 3.8 percent. The GDP estimates released today are based on more complete source data than were available for the…
State Quarterly Personal Income, 1st quarter 2006-3rd quarter 2007
WASHINGTON DC, DECEMBER 19, 2007 - U.S. personal income growth accelerated to 1.4 percent in the third quarter of 2007 from 0.9 percent in the second quarter. The acceleration returns the personal income growth rate close to its average for the last two years after a strong first quarter and weaker second quarter.
Tourism Satellite Accounts, Third Quarter 2007
December 2007
Real direct tourism spending increased at an annual rate of 1.6 percent in the third quarter of 2007, according to data released today by the U.S. Bureau of Economic Analysis. In the second quarter, real direct tourism spending (all output consumed by visitors) decreased 0.6 percent (revised). By comparison, real gross domestic product (GDP) grew at an annual rate of 4.9 percent (preliminary) in the third quarter…
U.S. International Transactions: Third Quarter 2007
U.S. International Transactions: Third Quarter 2007
U.S. International Trade in Goods and Services: October 2007
U.S. International Trade in Goods and Services OCTOBER 2007
-->
Personal Income and Outlays, October 2007
OCTOBER 2007 EMBARGOED UNTIL RELEASE AT 8:30 A.M. EST, FRIDAY, NOVEMBER 30, 2007 James E.


