Bureau of Economic Analysis
U.S. International Investment Position, 2nd Quarter 2025
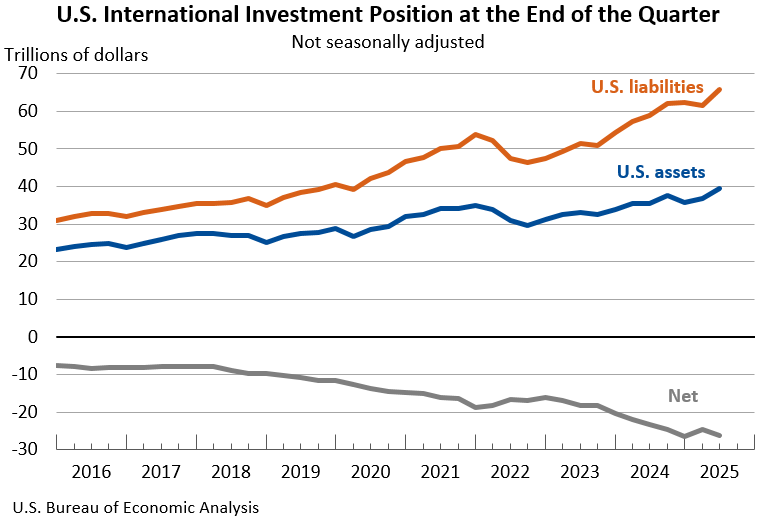
The U.S. net international investment position, the difference between U.S. residents’ foreign financial assets and liabilities, was -$26.14 trillion at the end of the second quarter of 2025, according to statistics released today by the U.S. Bureau of Economic Analysis. Assets totaled $39.56 trillion, and liabilities were $65.71 trillion. At the end of the first quarter, the net investment position was -$24.65 trillion (revised).
Principal Federal Economic Indicators
Noteworthy
The Latest
U.S. International Trade in Goods and Services, October 2022
The U.S. monthly international trade deficit increased in October 2022 according to the U.S. Bureau of Economic Analysis and the U.S. Census Bureau. The deficit increased from $74.1 billion in September (revised) to $78.2 billion in October, as imports increased and exports decreased. The goods deficit increased $6.1 billion in October to $99.6 billion. The services surplus increased $2.1 billion in October to $21.4 billion.
October 2022 Trade Gap is $78.2 Billion
The U.S. monthly international trade deficit increased in October 2022 according to the U.S. Bureau of Economic Analysis and the U.S. Census Bureau. The deficit increased from $74.1 billion in September (revised) to $78.2 billion in October, as imports increased and exports decreased. The goods deficit increased $6.1 billion in October to $99.6 billion. The services surplus increased $2.1 billion in October to $21.4 billion.
Vipin Arora Named New BEA Director
Vipin Arora was named the new Director of the Bureau of Economic Analysis, bringing decades of economic experience to the post. His new status is effective immediately.
Before joining BEA, Dr. Arora was acting Deputy Assistant Director of the Social, Behavioral and Economic Sciences Directorate at the National Science Foundation (NSF). He also served as Deputy Director of the NSF’s National Center for Science and Engineering…
Personal Income and Outlays, October 2022
Personal income increased $155.3 billion, or 0.7 percent at a monthly rate, while consumer spending increased $147.9 billion, or 0.8 percent, in October. The increase in personal income primarily reflected increases in compensation and personal current transfer receipts. The personal saving rate (that is, personal saving as a percentage of disposable personal income) was 2.3 percent in October, compared with 2.4 percent in September.
Gross Domestic Product (Second Estimate) Corporate Profits (Preliminary Estimate) Third Quarter 2022
Real gross domestic product (GDP) increased at an annual rate of 2.9 percent in the third quarter of 2022, in contrast to a decrease of 0.6 percent in the second quarter. The increase in the third quarter primarily reflected increases in exports and consumer spending that were partly offset by a decrease in housing investment.
Gross Domestic Product (Second Estimate) and Corporate Profits (Preliminary), Third Quarter 2022
Real gross domestic product (GDP) increased at an annual rate of 2.9 percent in the third quarter of 2022, in contrast to a decrease of 0.6 percent in the second quarter. The increase in the third quarter primarily reflected increases in exports and consumer spending that were partly offset by a decrease in housing investment. Profits decreased 1.1 percent at a quarterly rate in the third quarter after increasing 4.6 percent in the second…
Activities of U.S. Multinational Enterprises, 2020
Worldwide employment by U.S. multinational enterprises (MNEs) decreased 1.8 percent to 42.4 million workers in 2020 from 43.2 million workers in 2019.
Activities of U.S. Multinational Enterprises, 2020
Worldwide employment by U.S. multinational enterprises (MNEs) decreased 1.8 percent to 42.4 million workers in 2020 (preliminary) from 43.2 million workers in 2019 (revised), according to statistics released today by the U.S. Bureau of Economic Analysis (BEA) on the operations and finances of U.S. parent companies and their foreign affiliates.
Personal Income by County and Metropolitan Area, 2021
In 2021, personal income increased in 3,075 counties, decreased in 36, and was unchanged in 3. Personal income increased 7.4 percent in the metropolitan portion of the United States and 7.7 percent in the nonmetropolitan portion.


