Bureau of Economic Analysis
U.S. International Trade in Goods and Services, July 2025
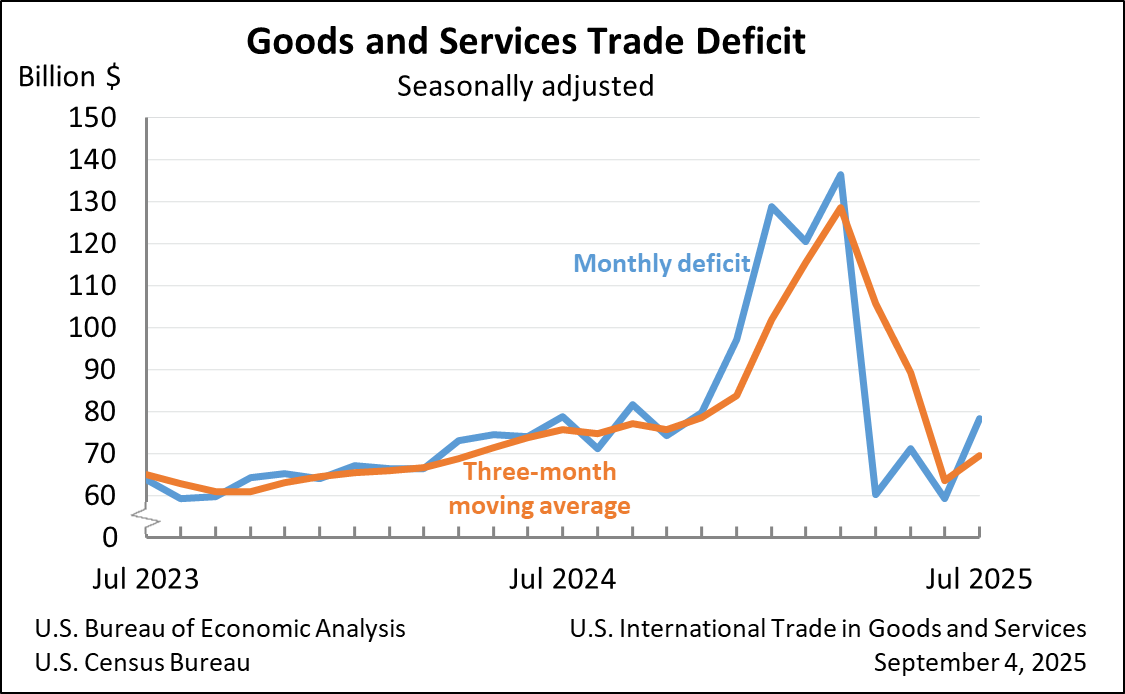
The U.S. goods and services trade deficit increased in July 2025 according to the U.S. Bureau of Economic Analysis and the U.S. Census Bureau. The deficit increased from $59.1 billion in June (revised) to $78.3 billion in July, as imports increased more than exports. The goods deficit increased $18.2 billion in July to $103.9 billion. The services surplus decreased $1.1 billion in July to $25.6 billion.
Principal Federal Economic Indicators
Noteworthy
The Latest
Value of U.S. Liabilities Increased More Than U.S. Assets in Fourth Quarter
The U.S. net international investment position was -$6,915.3 billion (preliminary) at the end of the fourth quarter of 2014 as the value of U.S. liabilities exceeded the value of U.S. assets. At the end of the third quarter, the net position was -$6,129.4 billion (revised).
Value of U.S. Liabilities Increased More than U.S. Assets in 2014
The U.S. net international investment position was -$6,915.3 billion (preliminary) at the end of 2014 as the value of U.S. liabilities exceeded the value of U.S. assets. At the end of 2013, the net position was -$5,383.0 billion.
U.S. International Investment Position, 4th quarter 2014
Notice About the 2015 Annual Revision of the U.S. Net International Investment Position
The annual revision of the U.S. net international investment position will be released along with preliminary estimates for the first quarter of 2015 on June 30, 2015. An article previewing the annual revisions will appear in the April 2015 issue of the Survey of Current Business.
Personal Savings Rate Rises in February
Personal income rose 0.4 percent in February, the same increase as in January. Wages and salaries, the largest component of personal income, rose 0.3 percent in February after rising 0.6 percent in January.
Current-dollar disposable personal income (DPI), after-tax income, rose 0.4 percent in February after rising 0.5 percent in January.
Real DPI, income adjusted for taxes and inflation, increased 0.2…
Personal Income and Outlays, February 2015
Personal income increased $58.6 billion, or 0.4 percent, and disposable personal income (DPI) increased $54.2 billion, or 0.4 percent, in February, according to the Bureau of Economic Analysis. Personal consumption expenditures (PCE) increased $11.8 billion, or 0.1 percent. In January, personal income increased $61.8 billion, or 0.4 percent, DPI increased $61.5 billion, or 0.5 percent, and PCE decreased $28.5 billion, or 0.2 percent, based on…
GDP Increases in Fourth Quarter
Real gross domestic product (GDP) increased 2.2 percent in the fourth quarter of 2014, according to the “third” estimate released by the Bureau of Economic Analysis. The growth rate was the same in the “second” estimate released in February. In the third quarter, real GDP increased 5.0 percent.
Fourth-quarter GDP highlights Consumer spending more than accounted for the increase in GDP, rising 4.4 percent, compared with 3.2 percent in…
Gross Domestic Product, 4th quarter and annual 2014 (third estimate); Corporate Profits, 4th quarter and annual 2014
Real gross domestic product -- the value of the production of goods and services in the United States, adjusted for price changes -- increased at an annual rate of 2.2 percent in the fourth quarter of 2014, according to the "third" estimate released by the Bureau of Economic Analysis. In the third quarter, real GDP increased 5.0 percent. The GDP estimate released today is based on more complete source data than were available for…
State Personal Income: Fourth Quarter 2014
State personal income grew 1.0 percent on average in the fourth quarter of 2014, the same average growth rate as in the third quarter. The acceleration in personal income growth in Florida, Texas, and 30 other states was offset by a slowdown in 15 states, including California and New York. Growth rates ranged from 0.6 percent in Louisiana to 1.5 percent in Texas. The national price index for personal consumption expenditures fell 0.1 percent…
State Personal Income 2014
Average state personal income growth accelerated to 3.9 percent in 2014 from 2.0 percent in 2013. Growth of state personal income – the sum of net earnings by place of residence, property income, and personal current transfer receipts – ranged from 0.5 percent Nebraska to 5.7 percent in Alaska and Oregon, with 45 states growing faster in 2014 than in 2013. Inflation, as measured by the national price index for personal consumption…
State Quarterly Personal Income, 1st quarter 2014 - 4th quarter 2014; State Annual Personal Income, 2014 (preliminary estimates)
Average state personal income growth accelerated to 3.9 percent in 2014 from 2.0 percent in 2013, according to estimates released today by the U.S. Bureau of Economic Analysis. Growth of state personal income–the sum of net earnings by place of residence, property income, and personal current transfer receipts–ranged from 0.5 percent in Nebraska to 5.7 percent in Alaska and Oregon, with 45 states growing faster in 2014 than in 2013.


