
Bureau of Economic Analysis
Personal Income and Outlays, July 2025
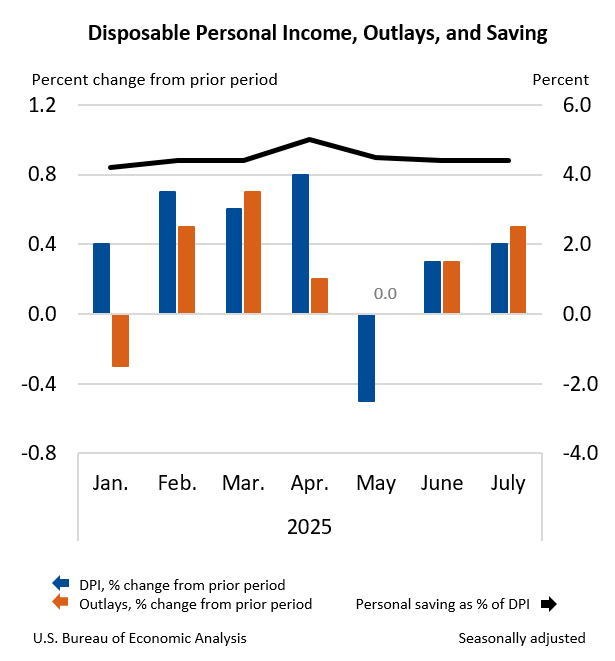
Personal income increased $112.3 billion (0.4 percent at a monthly rate) in July, according to estimates released today by the U.S. Bureau of Economic Analysis. Disposable personal income (DPI)—personal income less personal current taxes—increased $93.9 billion (0.4 percent) and personal consumption expenditures (PCE) increased $108.9 billion (0.5 percent). Personal outlays—the sum of PCE, personal interest payments, and personal current transfer payments—increased $110.9 billion in July. Personal saving was $985.6 billion in July and the personal saving rate—personal saving as a percentage of disposable personal income—was 4.4 percent.
Principal Federal Economic Indicators
Noteworthy
- 2025 News Release Schedule
- Innovation at BEA
- 2025 Annual Updates
- Distribution of Personal Income Nowcast
- New! Services Trade Data for More Countries
- Data Tool: Trade in Value Added
- Updated: RIMS II Regional Multipliers
- Arts and Culture
- Space Economy
- FDI Now in State BEARFACTS
- Quick Guide: Price Indexes


The Latest
Personal Income and Outlays, March 2010
Personal income increased $36.0 billion, or 0.3 percent, and disposable personal income (DPI) increased $32.3 billion, or 0.3 percent, inMarch, according to the Bureau of Economic Analysis. Personal consumption expenditures (PCE) increased $58.6 billion, or 0.6 percent.
Gross Domestic Product, 1st quarter 2010 (advance estimate)
Real gross domestic product -- the output of goods and services produced by labor and property located in the United States -- increased at an annual rate of 3.2 percent in the first quarter of 2010, (that is, from the fourth quarter to the first quarter), according to the "advance" estimate released by the Bureau of Economic Analysis.
Local Area Personal Income, 2008
Today, the Bureau of Economic Analysis (BEA) released estimates of personal income at the county level for 2008 based on newly available source data. The percent change from 2007 to 2008 in county personal income ranged from -48 percent in Slope County, North Dakota to 54 percent in Faulk County, South Dakota with growth slowing in more than two-thirds of the counties. For the nation, personal income grew 2.9 percent in 2008 after growing 5.…
Summary Estimates for Multinational Companies, 2008
NOTE: See the navigation bar at the right side of the news release text for links to data tables, contact personnel and their telephone numbers, and supplementary materials.
Summary Estimates for Multinational Companies: Employment, Sales, and Capital Expenditures for 2006--> -->
Personal Income and Outlays, February 2010
Personal income increased $1.2 billion, or less than 0.1 percent, and disposable personal income (DPI) increased $1.6 billion, or less than 0.1 percent, inFebruary, according to the Bureau of Economic Analysis. Personal consumption expenditures (PCE) increased $34.7 billion, or 0.3 percent.
Gross Domestic Product, 4th quarter 2009 (third estimate); Corporate Profits, 4th quarter 2009
Real gross domestic product -- the output of goods and services produced by labor and property located in the United States -- increased at an annual rate of 5.6 percent in the fourth quarter of 2009, (that is, from the third quarter to the fourth quarter), according to the "third" estimate released by the Bureau of Economic Analysis. In the third quarter, real GDP increased 2.2 percent. The GDP estimate released today is based…
State Quarterly Personal Income, 1st quarter 2006-4th quarter 2009; State Annual Personal Income, 2009 (preliminary estimate)
WASHINGTON DC, March 25, 2010 – State personal income declined an average 1.7 percent in 2009, according to estimates released today by the U.S. Bureau of Economic Analysis. The annual percentage change in state personal income ranged from -4.8 percent in Nevada to 2.1 percent in West Virginia (one of six states with a personal income gain in 2009). Inflation, as measured by the national price index for personal consumption expenditures,…
Travel and Tourism Satellite Accounts, 4th Quarter and Annual 2009
QUARTERLY TOURISM ESTIMATES WILL NOT BE DISCONTINUED (SEE THE BOX NEXT RELEASE)
-->
-->
Real spending on travel and tourism decreased at an annual rate of 2.3 percent in 2009:4, following an increase of 6.6 percent (revised) in 2009:3. By comparison, real gross domestic product (GDP) increased 5.9 percent (second estimate) in 2009:4 after increasing 2.2 percent in 2009:3. Travel and tourism prices…
U.S. International Transactions, 4th quarter 2009
NOTE: See the navigation bar at the right side of the news release text for links to data tables, contact personnel and their telephone numbers, and supplementary materials. -->